# Apexcharts-rs
[](https://crates.io/crates/apexcharts-rs)
[](https://github.com/clementwanjau/apexcharts-rs/actions/workflows/build.yaml)
This is a Rust WASM bindings for generating charts using the [ApexCharts](https://apexcharts.com/) JavaScript library. The library provides components for creating charts with the `yew` and `leptos` frameworks. ApexCharts is a modern open source charting library that helps developers to create beautiful and interactive visualizations for web pages.
## Browsers support
| [ ](http://godban.github.io/browsers-support-badges/)
Firefox | [ ](http://godban.github.io/browsers-support-badges/)
Chrome | [ ](http://godban.github.io/browsers-support-badges/)
Safari | [ ](http://godban.github.io/browsers-support-badges/)
Edge | [ ](http://godban.github.io/browsers-support-badges/)
IE11 |
|-------------------------------------------------------------------------------------------------------------------------------------------------------------------------------------------------------------------|---------------------------------------------------------------------------------------------------------------------------------------------------------------------------------------------------------------|---------------------------------------------------------------------------------------------------------------------------------------------------------------------------------------------------------------|--------------------------------------------------------------------------------------------------------------------------------------------------------------------------------------------------------|-----------------------------------------------------------------------------------------------------------------------------------------------------------------------------------------------------------------------|
| 31+ ✔ | 35+ ✔ | 6+ ✔ | Edge ✔ | [(IE11)](https://github.com/apexcharts/apexcharts.js?tab=readme-ov-file#using-it-with-ie11) ✔ |
## Usage
The components can be exposed for use by enabling features depending on the framework in use.
- ### Yew
```toml
[dependencies]
apexcharts-rs = {version="0.1", features=["yew"]}
```
and then in your code:
```rust,ignore
use yew::prelude::*;
use apexcharts_rs::prelude::{ApexChartComponent, ChartType, ChartSeries, SeriesData};
#[function_component]
fn MyApp() -> Html {
// This is the data to chart. The data is a vector of `ChartSeries`
// which contains the name of the series, the data points, color, type
// and z-index. Note that different charts require different data types.
let series = vec![
ChartSeries {
name: "New users".to_string(),
data: SeriesData::Single(vec![6500, 6418, 6456, 6526, 6356, 6456]),
color: "#1A56DB".to_string(),
r#type: None,
z_index: None,
}
];
// Options to further configure how the chart looks. Kindly refer to the ApexCharts documentation for more options.
let raw_options = r##"{
"chart": {
"fontFamily": "Inter, sans-serif",
"dropShadow": {
"enabled": false
},
"toolbar": {
"show": false
}
},
"xaxis": {
"categories": ["01 February", "02 February", "03 February", "04 February", "05 February", "06 February", "07 February"],
"labels": {
"show": false
},
"axisBorder": {
"show": false
},
"axisTicks": {
"show": false
}
},
"yaxis": {
"show": false
},
"legend": {
"show": false
},
"stroke": {
"width": 6,
"curve": "smooth"
},
"grid": {
"show": true,
"strokeDashArray": 4,
"padding": {
"left": 2,
"right": 2,
"top": 0
}
},
"dataLabels": {
"enabled": false
},
"tooltip": {
"enabled": true,
"x": {
"show": false
}
}
}"##;
html! {
}
}
pub fn main() {
yew::Renderer::::new().render();
}
```
- ### Leptos
ApexCharts supports leptos both in CSR (client side rendering) and SSR (server side rendering) mode. To use the library in a leptos project, you need to enable the `leptos` feature.
```toml
[dependencies]
apexcharts-rs = { version="0.1", features=["leptos"] }
```
and then in your code:
```rust,ignore
use leptos::*;
use apexcharts_rs::prelude::{ApexChartComponent, ChartType, ChartSeries, SeriesData};
#[component]
fn MyApp() -> impl IntoView {
// This is the data to chart. The data is a vector of `ChartSeries`
// which contains the name of the series, the data points, color, type
// and z-index. Note that different charts require different data types.
let series = vec![
ChartSeries {
name: "New users".to_string(),
data: SeriesData::Single(vec![6500, 6418, 6456, 6526, 6356, 6456]),
color: "#1A56DB".to_string(),
r#type: None,
z_index: None,
}
];
// Options to further configure how the chart looks. Kindly refer to the ApexCharts documentation for more options.
let raw_options = r##"{
"chart": {
"fontFamily": "Inter, sans-serif",
"dropShadow": {
"enabled": false
},
"toolbar": {
"show": false
}
},
"xaxis": {
"categories": ["01 February", "02 February", "03 February", "04 February", "05 February", "06 February", "07 February"],
"labels": {
"show": false
},
"axisBorder": {
"show": false
},
"axisTicks": {
"show": false
}
},
"yaxis": {
"show": false
},
"legend": {
"show": false
},
"stroke": {
"width": 6,
"curve": "smooth"
},
"grid": {
"show": true,
"strokeDashArray": 4,
"padding": {
"left": 2,
"right": 2,
"top": 0
}
},
"dataLabels": {
"enabled": false
},
"tooltip": {
"enabled": true,
"x": {
"show": false
}
}
}"##;
let (series, _) = create_signal(series);
view! {
}
}
pub fn main() {
mount_to_body(MyApp);
}
```
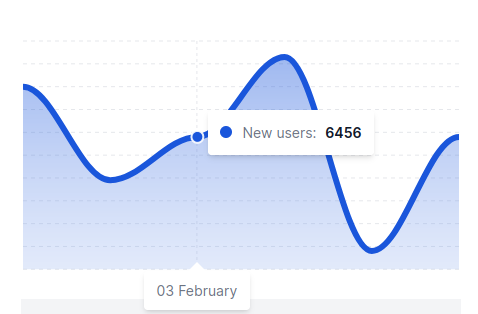
The above code will render the following chart:

To combine multiple series in a single chart, you can add more `ChartSeries` to the `series` vector.
## Currently Supported Charts
- Area Chart
- Line Chart
- Bar Chart
- Column Chart
- Pie Chart
- Donut Chart
- Radial Bar Chart
- Heatmap Chart
- Candlestick Chart
- Radar Chart
- Polar Area Chart
- Bubble Chart
- Scatter Chart
- Treemap Chart
- Box Plot Chart
- Range Bar Chart
## Series Data
The `SeriesData` enum is used to represent the data points for the chart. The data points can be a single value or a tuple of two values. The data points can be represented as follows:
```rust,ignore
use apexcharts_rs::prelude::SeriesData;
let data = SeriesData::Single(vec![6500, 6418, 6456, 6526, 6356, 6456]);
// or
let data = SeriesData::CategoryPaired(vec![
("01 February".to_string(), 6500),
("02 February".to_string(), 6418),
("03 February".to_string(), 6456),
("04 February".to_string(), 6526),
("05 February".to_string(), 6356),
("06 February".to_string(), 6456),
]);
// or
// Note that this data format should only be used for the Radial Charts
// like Pie Chart, Donut Chart, and Radial Bar Chart. The sum of the values
// should be 100.
let data = SeriesData::Radial(vec![
("Rent".to_string(), 42.0),
("Gas".to_string(), 12.4),
("Electricity".to_string(), 8.4),
("Food".to_string(), 11.2),
("Clothes".to_string(), 9.5),
("Entertainment".to_string(), 16.5),
]);
```
Different charts may require different data formats. Kindly refer to the ApexCharts documentation for more information.
For more examples check the [examples](./examples) directory.
## License
This project is licensed under the `Apache License 2.0` - see the [LICENSE](LICENSE) file for details
 ](http://godban.github.io/browsers-support-badges/)
 ](http://godban.github.io/browsers-support-badges/)
 ](http://godban.github.io/browsers-support-badges/)
 ](http://godban.github.io/browsers-support-badges/)
 ](http://godban.github.io/browsers-support-badges/)