C8
CHIP-8 / S-CHIP / XO-CHIP tui toolkit featuring a virtual machine, debugger, and disassembler
About •
Features •
Installation •
Usage •
Motivation
---
---
## Table of Contents
- [About](#about)
- [Features At A Glance](#features-at-a-glance)
- [Installation](#installation)
* [Install With Cargo](#install-with-cargo)
* [Build From Source](#build-from-source)
* [Installation Caveats](#installation-caveats)
- [Usage](#usage)
* [Running](#running)
* [Disassembling](#disassembling)
* [Debugging](#debugging)
+ [Start the Debugger](#start-the-debugger)
+ [Navigate the Debugger](#navigate-the-debugger)
+ [Control Program Execution](#control-program-execution)
+ [Breakpoints and Watchpoints](#breakpoints-and-watchpoints)
- [Motivation](#motivation)
## About
C8 is a terminal user interface tooklit made to run, debug, and disassemble **CHIP-8**, **S-CHIP**, and **XO-CHIP** games. At its core you can:
* run a rom with `c8 run [ROM_PATH]`
* add `--debug` to enable debug mode
* add `--kind` followed by `classic`, `chip8`, `schip`, or `xochip` to force other CHIP-8 variants if auto-select fails
* add `--hz` followed by your target instructions per second if needed
* disassemble a rom into a file with `c8 dasm [ROM_PATH] > [OUTPUT_FILE_PATH]`
* check a rom for potential issues* with `c8 check [ROM_PATH]`
## Features At A Glance
| Feature | C8
|----------------------------------------------------|-
| Full Chip-8 + Classic, S-CHIP, and XO-Chip Support | ✔
| Full Sound Support | ✔
| Full 4-bit Color Support | ✔
| `debug` Undo, Redo, and Step through Execution | ✔
| `debug` Virtual Machine State Inspection | ✔
| `debug` Register and Address Watchpoints | ✔
| `debug` Instruction Breakpoints | ✔
| `debug` Program Execution History | ✔
| `debug` Keyboard State Modification | ✔
| `debug` Dump Current Program Memory State | ✔
| Static Tracing Disassembler | ✔
| Configurable Execution Speed | ✔
| Compatibility Profiles | ✔
| Pre-defined and Custom Color Palettes | 🚧
| Individual Configurable Quirks | 🚧
###### Features labeled `debug` are only available in debug mode
## Installation
C8 is tested mostly on Windows but should work on Mac and Linux. If on Linux, see [below](#installation-caveats) for required system packages before you continue.
At this moment C8 can only be installed from cargo or built from source.
### Install With Cargo
C8 is published on crates.io and can be installed with cargo. Rust 1.70.0 or greater is required.
```
cargo install c8
```
### Build From Source
C8 can be built from source with [cargo](https://crates.io/). Rust 1.70.0 or greater is required.
```
git clone https://github.com/tochiu/c8.git
cd c8
cargo install --path ./
```
To be sure C8 is installed, run the classic IBM Logo ROM from the repository directory
```
c8 run roms/c8/ibm_logo.ch8
```
### Installation Caveats
On Linux, the X11 development libraries are required to query keyboard state from the OS since terminals generally do not support key up events. In addition, the Advanced Linux Sound Architecture (ALSA) development libraries are required on the system.
On Ubuntu/Debian:
```
sudo apt install libx11-dev
sudo apt install librust-alsa-sys-dev
```
On Fedora/RHEL/CentOS:
```
sudo dnf install xorg-x11-server-devel
sudo dnf install alsa-lib-devel
```
On newer versions of MacOS, you may run into issues where you only see meta keys such as shift,
backspace, et cetera. This is due to a permission issue. To work around this:
* open the MacOS system preferences
* go to Security -> Privacy
* scroll down to Accessibility and unlock it
* add your terminal to the list
## Usage
### Running
To run a CHIP-8 program, use the `c8 run` command followed by the path to the program.
- If you require the program runs at a specified frequency add the `--hz` flag followed by a target instructions per second (IPS) value
- To specify a CHIP-8 variant, add a `--kind` flag followed by either `chip8`, `classic`, `schip`, or `xochip`
- If `--kind` is not specified, c8 will make a best guess of the CHIP-8 variant
- To load the program into the debugger, add the `--debug` flag
> [!IMPORTANT]
> The `classic` variant is not a full COSMAC VIP emulator but instead just the quirk settings from CHIP-8 on a VIP.
For example:
```
c8 run roms/xo/super_neatboy.ch8 --hz 50000 --kind xochip
```
will run the Super Neatboy rom at 50000 IPS on the XO-CHIP variant. In the above example, the `--kind` flag is not necessary since C8 will auto-select the XO-CHIP variant.
### Disassembling
The C8 disassembler is a static tracing disassembler. It will not execute the program to disassemble it but will instead trace the program from the starting address through all possible branches to determine what regions of memory are code and what regions are data. From there, it will output a view of program memory with the disassembled instructions alongside the raw memory data. Because this is a static analysis of the program, self-modifying code will not dissassemble quite well. The dissassembler will not always be certain whether a given address is an instruction or not (*see: The Halting Problem*). Each address is annotated with a label indicating the confidence level of that address being an instruction. The labels are as follows:
| Symbol | Label | Description
|--------|------------|------------
|`' '` | `NOT` | The address is not an instruction
|`'?'` | `PARSABLE` | The address can be parsed as a valid instruction
|`'*'` | `REACHABLE`| The address can be parsed as a valid instruction and can theoretically be executed by the program
|`'O'` | `VALID` | The address can be parsed as a valid instruction and can theoretically be executed by the program, and can be part of at least one static execution path
|`'X'` | `PROVEN` | The address is an instruction that is part of at least one static execution path
A *static execution path* is a sequence of instructions beginning at the starting instruction address (`0x200`) that can be executed by the program without a dependence on the state of the virtual machine.
For example, an instruction that jumps to a specific location in memory from the starting address will create a new static (`X` label) execution path starting from that location. The disassembler will follow all possible static execution paths to determine the confidence level of each address.
But if an instruction jumps to a location in memory that is determined by something like a value in a register, the disassembler will create a new reachable (`*` label) execution path starting from all possible jump locations. This is because the disassembler cannot determine the value of the register at the time of disassembly. From there, the disassembler will follow all possible execution paths to determine the confidence level of each address. Some addresses will be promoted to valid (`O` label) if they are lead back to at least one static execution path.
To disassemble a CHIP-8 program, use the `c8 dasm` command followed by the path to the program. This will print the disassembled program to the standard output. Add a `--kind` flag to specify the CHIP-8 variant. For example:
```
c8 dasm roms/ch8/ibm_logo.ch8
```
will dissasemble the *ibm_logo* rom and output the following:
```
0x200 cls # X 00E0 clear
0x202 ld i 0x22A # X A22A i = 0x22A
0x204 ld v0 12 # X 600C v0 = 12
0x206 ld v1 8 # X 6108 v1 = 8
0x208 drw v0 v1 15 # X D01F draw 8x15 @ v0,v1
0x20A add v0 9 # X 7009 v0 += 9
0x20C ld i 0x239 # X A239 i = 0x239
0x20E drw v0 v1 15 # X D01F draw 8x15 @ v0,v1
0x210 ld i 0x248 # X A248 i = 0x248
0x212 add v0 8 # X 7008 v0 += 8
0x214 drw v0 v1 15 # X D01F draw 8x15 @ v0,v1
0x216 add v0 4 # X 7004 v0 += 4
0x218 ld i 0x257 # X A257 i = 0x257
0x21A drw v0 v1 15 # X D01F draw 8x15 @ v0,v1
0x21C add v0 8 # X 7008 v0 += 8
0x21E ld i 0x266 # X A266 i = 0x266
0x220 drw v0 v1 15 # X D01F draw 8x15 @ v0,v1
0x222 add v0 8 # X 7008 v0 += 8
0x224 ld i 0x275 # X A275 i = 0x275
0x226 drw v0 v1 15 # X D01F draw 8x15 @ v0,v1
0x228 jp 0x228 # X 1228
0x22A # FF 2X GRAPHIC @@@@@@@@@@@@@@@@
0x22B # 00 2X GRAPHIC ................
0x22C # FF 2X GRAPHIC @@@@@@@@@@@@@@@@
0x22D # 00 2X GRAPHIC ................
0x22E # ? 3C00 2X GRAPHIC ....@@@@@@@@....
0x22F # 00 2X GRAPHIC ................
0x230 # ? 3C00 2X GRAPHIC ....@@@@@@@@....
0x231 # 00 2X GRAPHIC ................
0x232 # ? 3C00 2X GRAPHIC ....@@@@@@@@....
0x233 # 00 2X GRAPHIC ................
0x234 # ? 3C00 2X GRAPHIC ....@@@@@@@@....
0x235 # 00 2X GRAPHIC ................
0x236 # FF 2X GRAPHIC @@@@@@@@@@@@@@@@
0x237 # 00 2X GRAPHIC ................
0x238 # FF 2X GRAPHIC @@@@@@@@@@@@@@@@
0x239 # FF 2X GRAPHIC @@@@@@@@@@@@@@@@
0x23A # 00 2X GRAPHIC ................
0x23B # FF 2X GRAPHIC @@@@@@@@@@@@@@@@
0x23C # 00 2X GRAPHIC ................
0x23D # ? 3800 2X GRAPHIC ....@@@@@@......
0x23E # 00 2X GRAPHIC ................
0x23F # ? 3F00 2X GRAPHIC ....@@@@@@@@@@@@
0x240 # 00 2X GRAPHIC ................
0x241 # ? 3F00 2X GRAPHIC ....@@@@@@@@@@@@
0x242 # 00 2X GRAPHIC ................
0x243 # ? 3800 2X GRAPHIC ....@@@@@@......
0x244 # 00 2X GRAPHIC ................
0x245 # FF 2X GRAPHIC @@@@@@@@@@@@@@@@
0x246 # 00 2X GRAPHIC ................
0x247 # FF 2X GRAPHIC @@@@@@@@@@@@@@@@
0x248 # ? 8000 2X GRAPHIC @@..............
0x249 # ? 00E0 2X GRAPHIC ................
0x24A # E0 2X GRAPHIC @@@@@@..........
0x24B # ? 00E0 2X GRAPHIC ................
0x24C # E0 2X GRAPHIC @@@@@@..........
0x24D # 00 2X GRAPHIC ................
0x24E # ? 8000 2X GRAPHIC @@..............
0x24F # 00 2X GRAPHIC ................
0x250 # ? 8000 2X GRAPHIC @@..............
0x251 # ? 00E0 2X GRAPHIC ................
0x252 # E0 2X GRAPHIC @@@@@@..........
0x253 # ? 00E0 2X GRAPHIC ................
0x254 # E0 2X GRAPHIC @@@@@@..........
0x255 # 00 2X GRAPHIC ................
0x256 # 80 2X GRAPHIC @@..............
0x257 # F8 2X GRAPHIC @@@@@@@@@@......
0x258 # 00 2X GRAPHIC ................
0x259 # FC 2X GRAPHIC @@@@@@@@@@@@....
0x25A # 00 2X GRAPHIC ................
0x25B # ? 3E00 2X GRAPHIC ....@@@@@@@@@@..
0x25C # 00 2X GRAPHIC ................
0x25D # ? 3F00 2X GRAPHIC ....@@@@@@@@@@@@
0x25E # 00 2X GRAPHIC ................
0x25F # ? 3B00 2X GRAPHIC ....@@@@@@..@@@@
0x260 # 00 2X GRAPHIC ................
0x261 # ? 3900 2X GRAPHIC ....@@@@@@....@@
0x262 # 00 2X GRAPHIC ................
0x263 # F8 2X GRAPHIC @@@@@@@@@@......
0x264 # 00 2X GRAPHIC ................
0x265 # F8 2X GRAPHIC @@@@@@@@@@......
0x266 # 03 2X GRAPHIC ............@@@@
0x267 # 00 2X GRAPHIC ................
0x268 # 07 2X GRAPHIC ..........@@@@@@
0x269 # 00 2X GRAPHIC ................
0x26A # 0F 2X GRAPHIC ........@@@@@@@@
0x26B # 00 2X GRAPHIC ................
0x26C # ? BF00 2X GRAPHIC @@..@@@@@@@@@@@@
0x26D # 00 2X GRAPHIC ................
0x26E # FB 2X GRAPHIC @@@@@@@@@@..@@@@
0x26F # 00 2X GRAPHIC ................
0x270 # F3 2X GRAPHIC @@@@@@@@....@@@@
0x271 # 00 2X GRAPHIC ................
0x272 # E3 2X GRAPHIC @@@@@@......@@@@
0x273 # 00 2X GRAPHIC ................
0x274 # ? 43E0 2X GRAPHIC ..@@........@@@@
0x275 # E0 2X GRAPHIC @@@@@@..........
0x276 # ? 00E0 2X GRAPHIC ................
0x277 # E0 2X GRAPHIC @@@@@@..........
0x278 # 00 2X GRAPHIC ................
0x279 # ? 8000 2X GRAPHIC @@..............
0x27A # 00 2X GRAPHIC ................
0x27B # ? 8000 2X GRAPHIC @@..............
0x27C # 00 2X GRAPHIC ................
0x27D # ? 8000 2X GRAPHIC @@..............
0x27E # 00 2X GRAPHIC ................
0x27F # ? 8000 2X GRAPHIC @@..............
0x280 # ? 00E0 2X GRAPHIC ................
0x281 # E0 2X GRAPHIC @@@@@@..........
0x282 # ? 00E0 2X GRAPHIC ................
0x283 # E0 2X GRAPHIC @@@@@@..........
```
Each relevant address is printed with the instruction if needed.
Past the `#` symbol is the label of that address. Because *ibm_logo* is a simple program, every address is labelled either a proven instruction (`X` label) or data with the occasional `?` label if it happens to be parsable as an instruction.
Following the label is the value at that address in hexadecimal:
- If the address is an instruction, this is as long as the instruction is with overlapping addresses being collapsed
- If the address is data, this one byte
Last is a description of the instruction or data:
- If the address is an instruction then a description of the instruction is printed
- If the address is data then a visual representation of the byte data is printed
In this case, the visual representation of the data region showcases the IBM graphic that is saved in the rom.
> [!NOTE]
> This dissassembler doubles as a memory viewer. The memory panel in the debugger is simply an up-to-date dissasembly of program memory.
`c8 check` is a tool built on top of the disassembler that checks a rom for bad execution branches. It accomplishes this by running the disassembler on the program and logging areas where proven (`X` label) or valid (`O` label) instructions can lead to executing an invalid instruction.
### Debugging
#### Start the Debugger
In order to debug a CHIP-8 program, run
```
c8 run [PATH_TO_PROGRAM] --debug
```
This will start the debugger with the program loaded in a paused state right before the first instruction is executed. Use the `help` command to see the full list of commands. At any point, press `Ctrl+C` to exit.
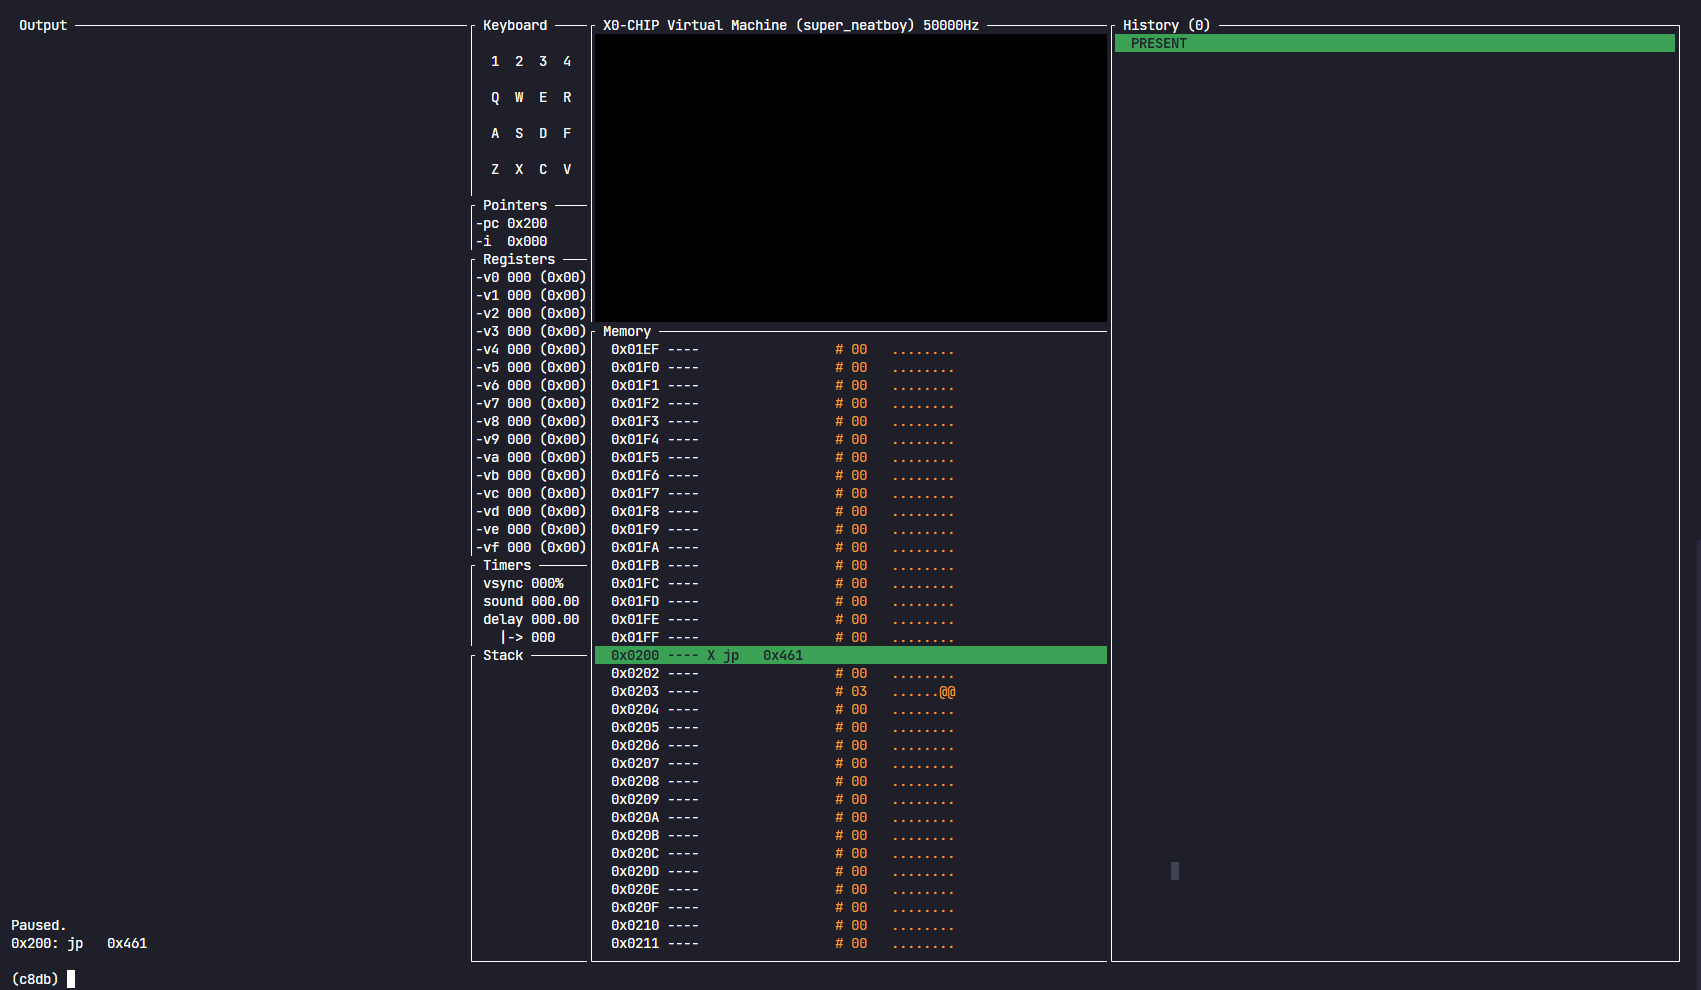
#### Navigate the Debugger
Below is what the debugger looks like when it first starts:
> [!TIP]
> Make sure the terminal window is as big as possible to ensure every panel is visible.
At a glance there will be:
- A command line interface with an output
- To expand the output panel, use the `output` command
- The program display
- To toggle the program display, use the `show display` or `hide display` command
- The program keyboard state, register state, timer state, and stack
- The program memory layout
- To expand the memory panel, use the `memory` command
- To toggle a verbose view of the memory layout, use the `show memory -v` or `hide memory -v` command
- To navigate to a specific memory address, use the `goto` command followed by `pc`, `i`, or a specific address
- To follow a pointer in memory, use the `follow` command followed by a pointer (e.g. `pc` or `i`)
- To unfollow the currently followed pointer, use the `unfollow` command
- To dump the entire memory view to a file, use the `dump memory` command followed by a file path
- The program history
- To focus onto history panel, use the `history` command
> [!TIP]
> When focused on a panel (e.g. memory), You can seek to the start or the end using the `Home` and `End` keys. Use the `Esc` key to return to the command line interface.
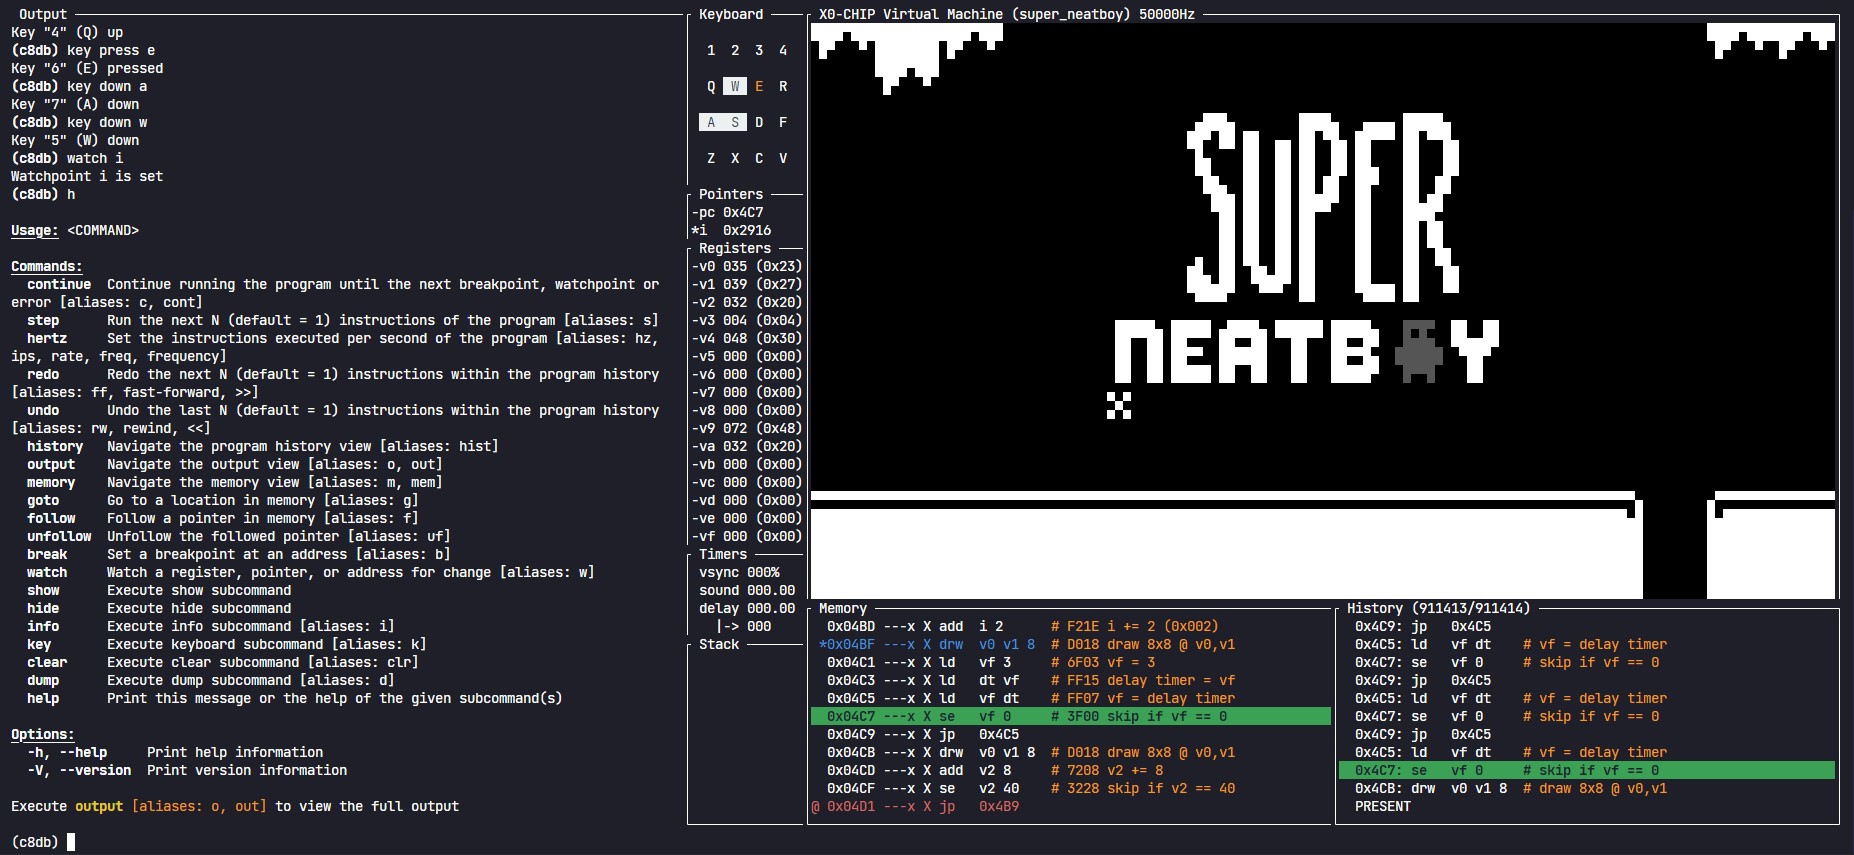
On SCHIP and XOCHIP programs, the high resolution graphics mode alters the UI layout to look like the following:
#### Control Program Execution
**Run the program:**
Start the execution of your program with the `continue` command:
```
(c8db) continue
```
This will minimize the debugger and run the program until a debug event is triggered or execution is paused. Press `Esc` to pause execution and return to the debugger.
> [!IMPORTANT]
> A debug event is a trigger that interrupts program execution and drops into the debugger window. The features in C8DB that trigger debug events are watchpoints and breakpoints.
> - A breakpoint is set to trigger right before an instruction at a specified address is executed
> - A watchpoint is set to trigger right after a specified register or address is modified
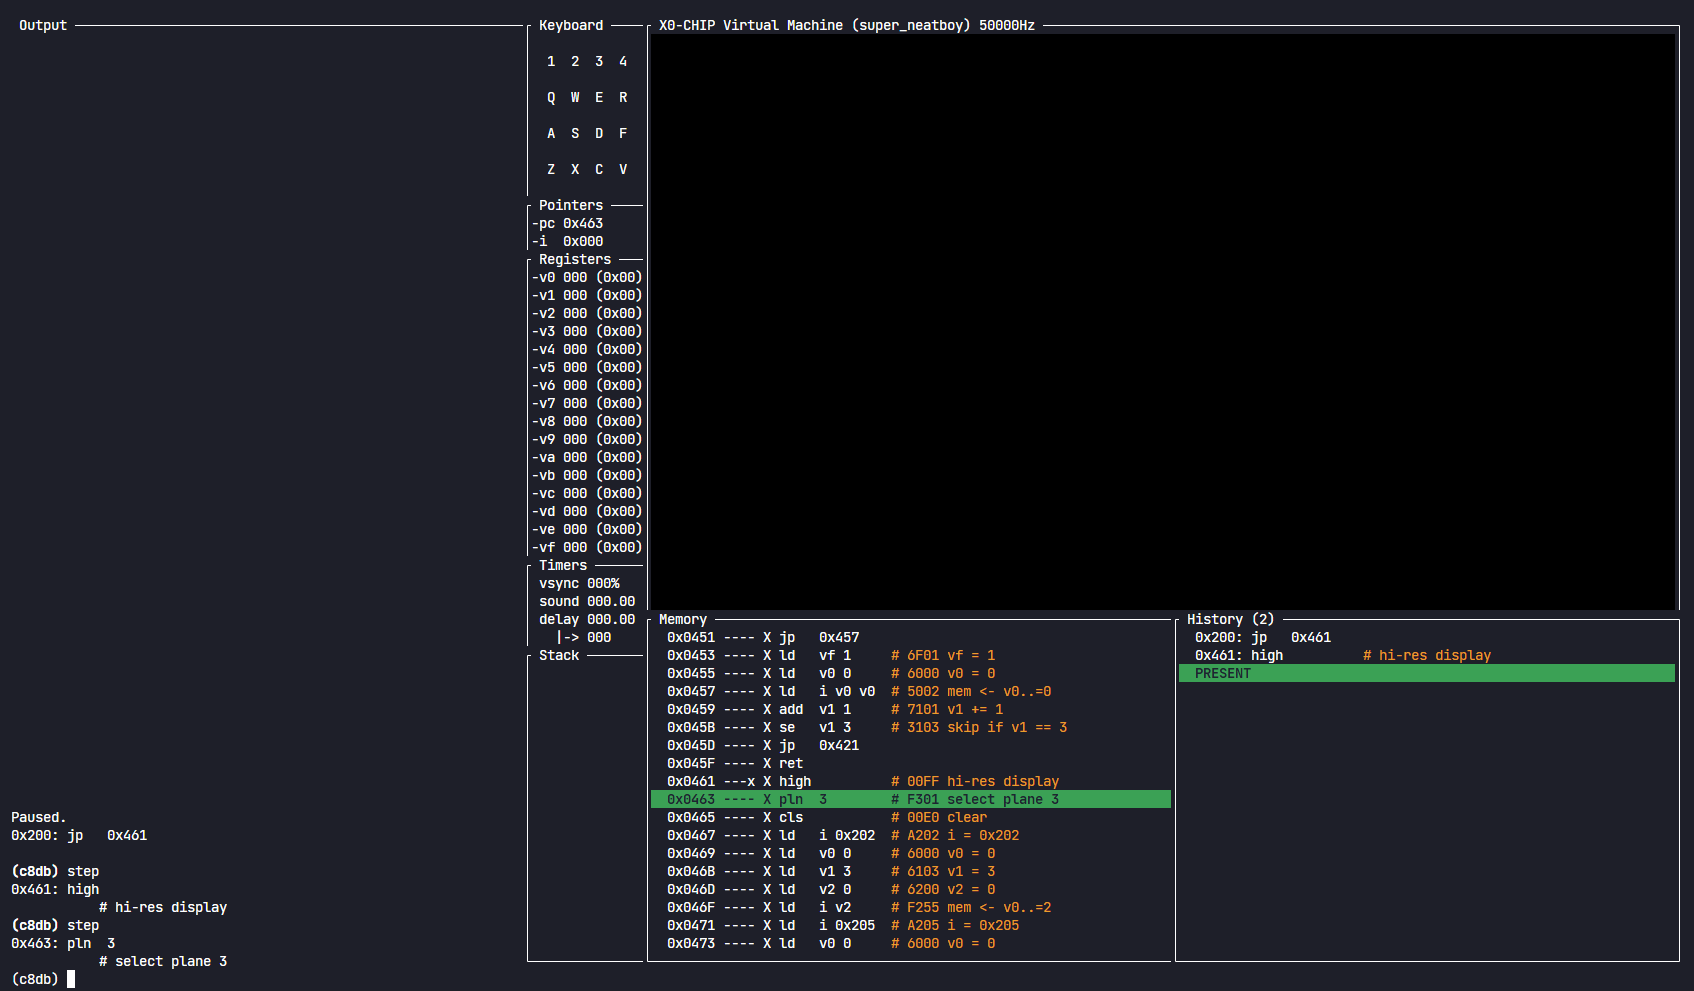
**Step through the program:**
Use `step` to execute the next instruction. Follow it with an integer `n` to execute the next `n` instructions. This will be interrupted if a debug event is triggered. For example:
```
(c8db) step 50
```
will execute the next 50 instructions.
> [!NOTE]
> If you use `step` or `continue` with a past program state (reachable using `undo`), all future program states are cleared and execution will advance. If instead you would like to replay those future states, use `redo` instead.
> [!TIP]
> If you are stuck on an instruction because it is polling for a key event, use the `key` command to simulate key events. Type `key --help` for more information.
**Seek through execution history:**
Use `undo` and `redo` to seek through the program execution history. Follow it with an integer `n` to rewind or fast-forward through the last `n` program states.
Alternatively, use the `history` command to focus onto the program history panel. Use the W/S or Up/Down keys to seek through program execution. This is just a graphical layer over the `undo` and `redo` commands.
`redo` is a particularly special command. Technically, it doesn't simply execute the next instruction, since the execution of some instructions are non-deterministic with respect to the program state, e.g. user input or RNG. If necessary, certain properties are stored between executing instructions in order to properly replay it. That is what `redo` utilizes.
If you are in a specific program state and instead of replaying, you want to execute the program from that point, use `step` or `continue` instead.
**Set execution speed:**
Use `hertz` followed by `n`, where `n` is the target speed in instructions per second, to set the program execution speed. For example:
```
(c8db) hertz 60
```
will execute the program at a rate of 60 instructions per second.
> [!IMPORTANT]
> **C8 runs at a fixed frame-rate of 60hz.** If your target execution speed is expressed in cycles per frame, multiply it by 60 to get the equivalent instructions per second.
#### Breakpoints and Watchpoints
Sometimes it is useful to pause execution when a certain condition is met. This is where breakpoints and watchpoints come in. A *breakpoint* is set to trigger right before an instruction at a specified address is executed. A *watchpoint* is set to trigger right after a specified register or address is modified.
**Set a breakpoint:**
Use `break` followed by an address to set a breakpoint. For example:
```
(c8db) break 0x200
```
will set a breakpoint at address `0x200`. Once the program reaches this address, execution will pause and drop into the debugger. To list all breakpoints, type `info break`. To remove a breakpoint, use the `clear` command. In this example:
```
(c8db) clear break 0x200
```
will remove the breakpoint at address `0x200`. To clear all breakpoints, type `clear all break`.
**Set a watchpoint:**
Use `watch` followed by a register or address to set a watchpoint. For example:
```
(c8db) watch i
```
will set a watchpoint on register `i`. Once this register is modified, execution will pause and drop into the debugger. If we set a watchpoint on an adresss instead, execution will pause when that address is written to. To list all watchpoints, type `info watch`. To remove a watchpoint, use the `clear` command. In this example:
```
(c8db) clear watch i
```
will remove the watchpoint on register `i`. To clear all watchpoints, type `clear all watch`.
## Motivation
This is my first _completed_ rust project (haha). A friend of mine sent me an [article](https://tobiasvl.github.io/blog/write-a-chip-8-emulator/) on how to get started with writing emulators with CHIP-8. It was a super interesting read and a good excuse to learn Rust! After I finished the emulator, I thought I could go further. So here we are. If you're thinking about writing your own CHIP-8 emulator, you should! It's a great start to emulation development and building on top of it with other CHIP-8 variants is an excellent exercise in writing extensible software.