# preexplorer
[](https://crates.io/crates/preexplorer)
[](https://github.com/saona-raimundo/preexplorer)
[](https://docs.rs/preexplorer/)
[](https://crates.io/crates/preexplorer)
Easy plotter and saver of simple data. Handy tool for development stage or small computational projects. Save data, have a quick view and an initial [gnuplot](http://www.gnuplot.info/) script to plot it.
If you are looking for a pure Rust plotter, check out [`plotters`](https://crates.io/crates/plotters).
# Purpose
Do you have a costly process in Rust and want to save the data for postprocessing?
Would you like to still have a basic glance to check it and leave fine-tuning of the plot for later?
This is the crate for you!
# Work flow
1. Compute your thing in Rust
2. Pass the results to a suitable struct from ``preexplorer``, or use the ``preexplore`` method.
3. Use the method ``plot`` or ``plot_later``.
After ``cargo run``, your data is saved and a suitable first script for gnuplot to plot the data is saved. If you used ``plot``, you will get a plot by gnuplot that you can save.
The gnuplot script is located in
``target\\preexplorer\\plots\\my_identifier.gnu``
where ``my_identifier`` is the name you gave in rust to the plot.
Therefore, to run it in gnuplot (and get the plot again), run from the console
``gnuplot target\\preexplorer\\plots\\my_identifier.gnu``
- Want a different plot? Change this file according to your needs and run again.
- Want to use gnuplot as an interactive plotting engine? Run ``gnuplot`` in the console, copy and paste the script and keep going with your favorite gnuplot commands.
# Main features
- Easy plotting
- Easy comparison
- Implementable traits
- Extensive documentation
# Gallery
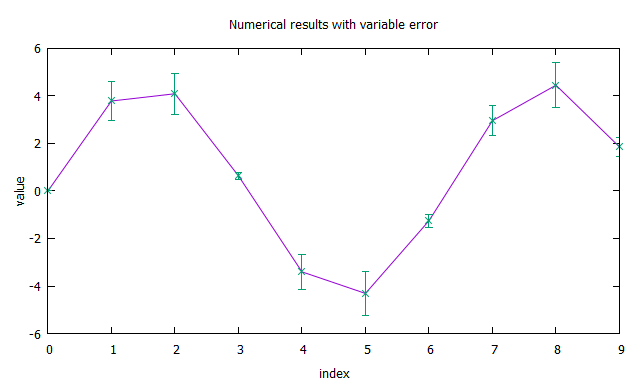
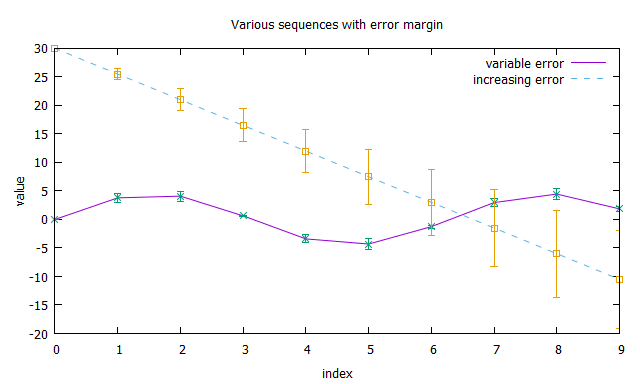
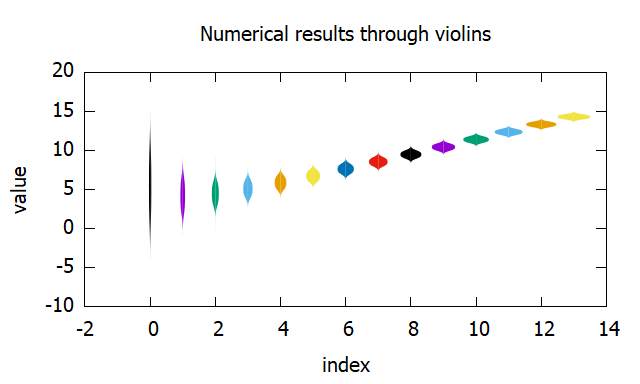
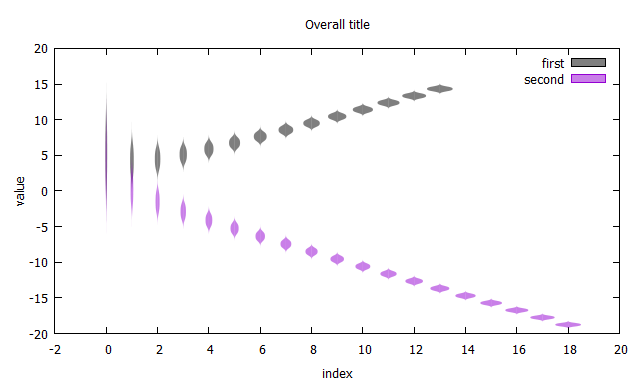
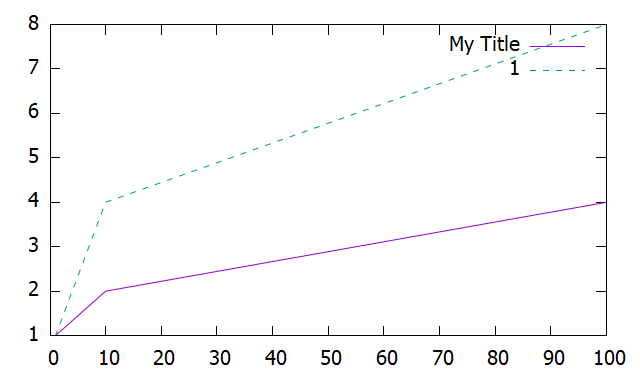
## Sequences
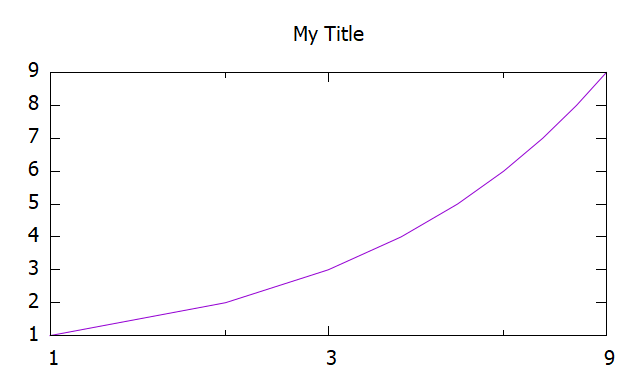
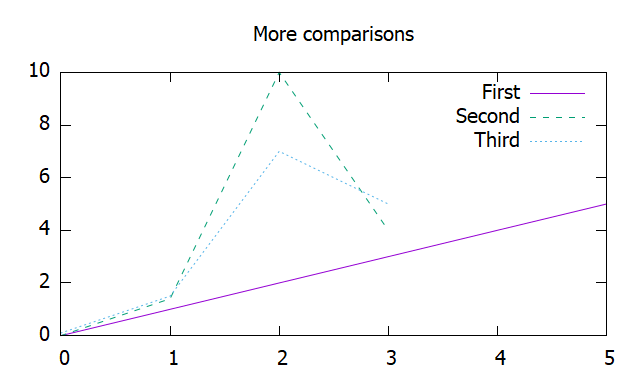
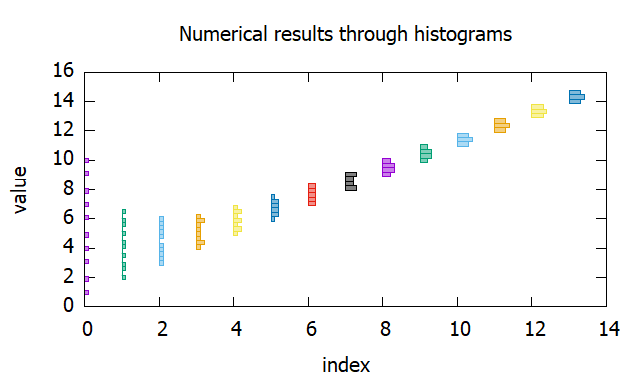
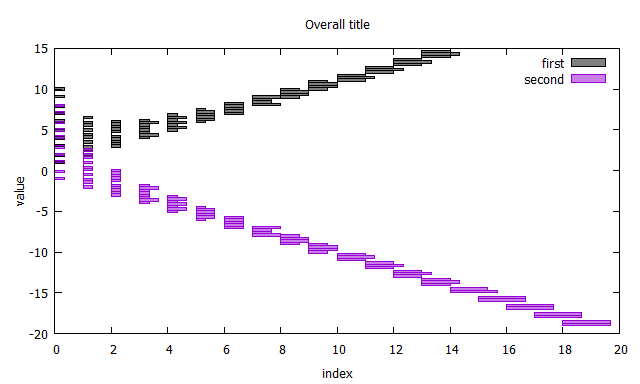
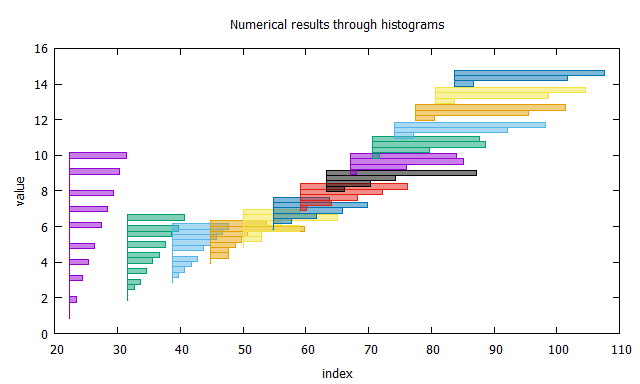
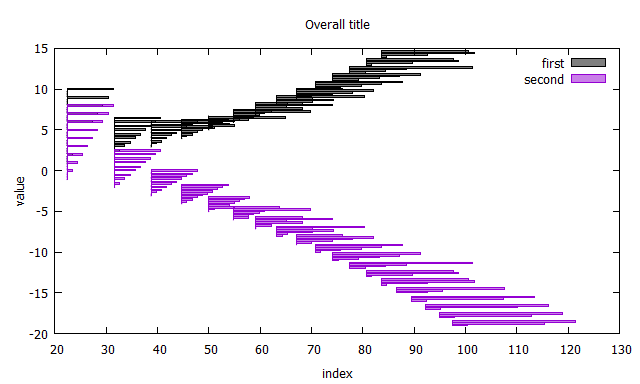
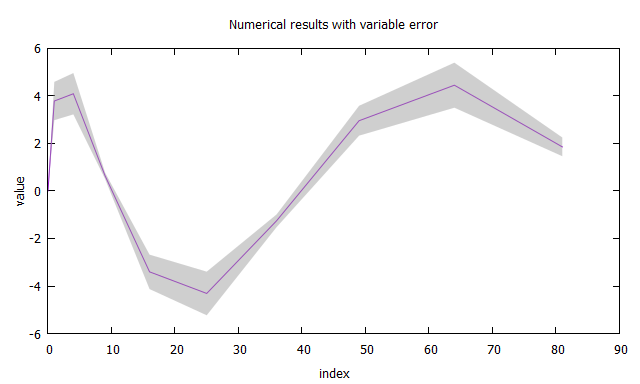
 ## Processes

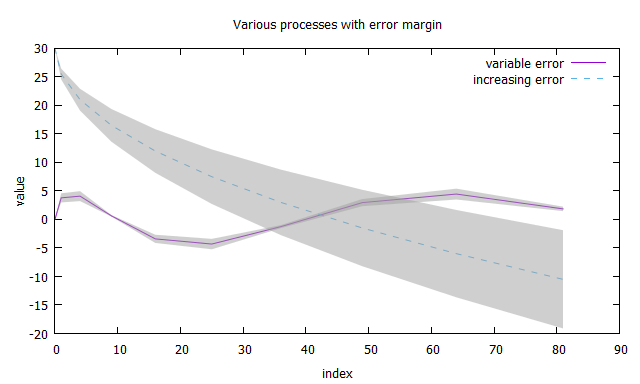
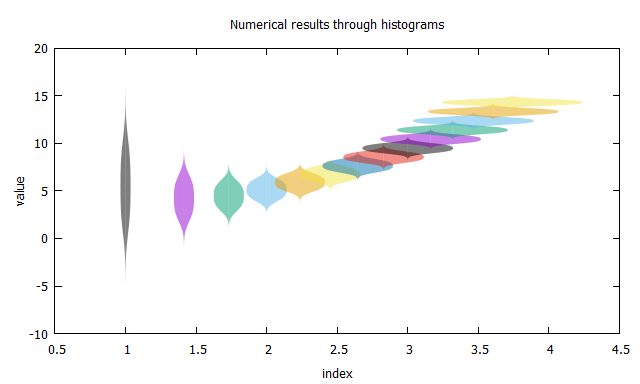
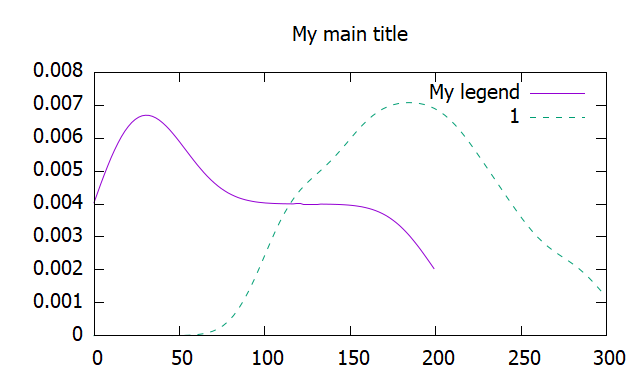
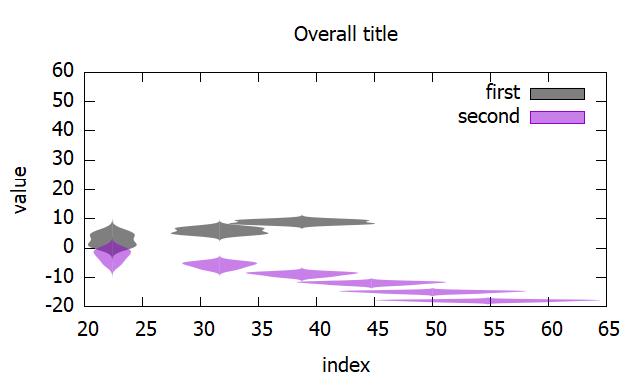 ## Densities

 ## Heatmaps

 ## Contour
 For more, see the folder [examples](https://github.com/saona-raimundo/preexplorer/tree/master/examples).
# Installation
- Download and [install gnuplot](http://www.gnuplot.info/download.html), a command line engine for plotting. (Note that the gnuplot project has nothing to do with GNU).
- Add ``preexplorer = "*"`` to your ``Cargo.toml`` file under ``[dependencies]``.
- I suggest to simply go with ``use preexplorer::prelude::*;`` in your binary, and then use the short-name ``pre::...`` and the ``preexplore`` method directly in iterators and tuple of iterators.
# Q & A
1. When comparing processes (`Process`-related structs), why must they be the same structs?
The comparison of processes (`Processes`-related structs) are a collection of processes. As such, it works as `Vec`, so two process structs must be the same type to be compared.
2. Are there n-dimensional variants?
No, it is out of scope. If you want to implement similar functionalities, you can do so easily based on the source code for `Data`.
3. How to deactivate some options, e.g. tics?
All structs implement the trait `Configurable`. Each option has documented how to disable it in its corresponding method.
# Disclaimer
There is no connection with the gnuplot project.
# Changelog
See [Changelog](https://github.com/saona-raimundo/preexplorer/blob/master/Changelog.md).
# References
- [Overview: What should a good plot look like?](https://serialmentor.com/dataviz/)
- [Choosing colors blog post](https://www.storytellingwithdata.com/blog/2020/5/6/picking-the-right-colors)
- [Color scheme designer](https://paletton.com)
# For the reader
Has this project been useful to you? How? :)
Let me know through a github issue!
# Similar crates
- [debug_plotter](https://crates.io/crates/debug_plotter)
+ Convenient macro to quickly plot variables using pure Rust `plotters` crate


 ## Processes


 ## Densities

 ## Heatmaps

 ## Contour
 For more, see the folder [examples](https://github.com/saona-raimundo/preexplorer/tree/master/examples).
# Installation
- Download and [install gnuplot](http://www.gnuplot.info/download.html), a command line engine for plotting. (Note that the gnuplot project has nothing to do with GNU).
- Add ``preexplorer = "*"`` to your ``Cargo.toml`` file under ``[dependencies]``.
- I suggest to simply go with ``use preexplorer::prelude::*;`` in your binary, and then use the short-name ``pre::...`` and the ``preexplore`` method directly in iterators and tuple of iterators.
# Q & A
1. When comparing processes (`Process`-related structs), why must they be the same structs?
The comparison of processes (`Processes`-related structs) are a collection of processes. As such, it works as `Vec