# Examples Gallery
- [Graph types](#graph-types)
- [Cloropleth](#cloropleth)
- [Interactive Vconcat](#interactive-vconcat)
- [Diverging Stacked Bar Chart](#diverging-stacked-bar-chart)
- [Scatterplot](#scatterplot)
- [Stacked Bar Graph](#stacked-bar-graph)
- [Stock Graph](#stock-graph)
- [Line with confidence Interval](#line-with-confidence-interval)
- [Data Sources](#data-sources)
- [From ndarray](#from-ndarray)
- [From csv](#from-csv)
- [From url](#from-url)
- [From JSON spec](#from-json-spec)
- [From JSON spec with new Data](#from-json-spec-with-new-data)
- [From nalgebra](#from-nalgebra)
- [From rulinalg](#from-rulinalg)
- [Miscellaneous](#miscellaneous)
- [Without using builders](#without-using-builders)
## Graph types
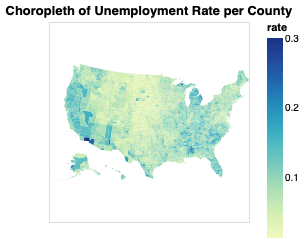
### [Cloropleth](https://github.com/procyon-rs/vega_lite_3.rs/blob/master/examples/cloropleth_unemployment.rs)
```bash
cargo run --example cloropleth_unemployment
```
Display data from a csv and a tsv as a cloropleth on a geo projection.
### [Interactive Vconcat](https://github.com/procyon-rs/vega_lite_3.rs/blob/master/examples/vconcat_interactive.rs)
```bash
cargo run --example vconcat_interactive
```
Display two charts that can be be interact together through selection

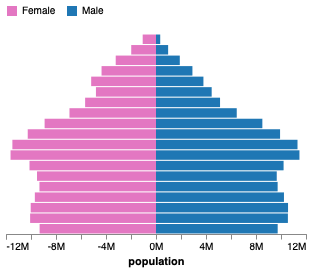
### [Diverging Stacked Bar Chart](https://github.com/procyon-rs/vega_lite_3.rs/blob/master/examples/diverging_stacked_bar_chart.rs)
```bash
cargo run --example diverging_stacked_bar_chart
```
Display data from a json after doing some transformation on it as a stacked bar chart
### [Scatterplot](https://github.com/procyon-rs/vega_lite_3.rs/blob/master/examples/scatterplot.rs)
```bash
cargo run --example scatterplot
```
Loads data from a `csv`, deserializing to a `struct`, and display a colored scatterplot.

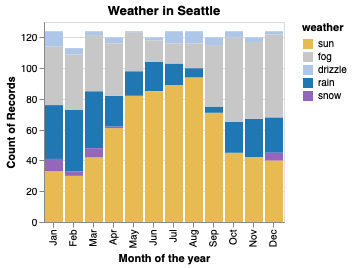
### [Stacked Bar Graph](https://github.com/procyon-rs/vega_lite_3.rs/blob/master/examples/stacked_bar_chart.rs)
```bash
cargo run --example stacked_bar_chart
```
Loads data from an URL, displaying the aggregated count by type by month as a stacked bar graph.
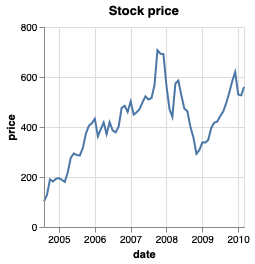
### [Stock Graph](https://github.com/procyon-rs/vega_lite_3.rs/blob/master/examples/stock_graph.rs)
```bash
cargo run --example stock_graph
```
Loads data from a `csv`, deserializing to a `struct`, and display the graph as a line.
### [Line with confidence Interval](https://github.com/procyon-rs/vega_lite_3.rs/blob/master/examples/line_with_interval.rs)
```bash
cargo run --example line_with_interval.rs
```
Loads data from an URL, displaying the aggregated mean by year with the variance on a two level layers as a line graph.

## Data Sources
### [From ndarray](https://github.com/procyon-rs/vega_lite_3.rs/blob/master/examples/from_ndarray.rs)
```bash
cargo run --example from_ndarray
```
Loads data directly from a random [`ndarray::Array2`](https://docs.rs/ndarray/latest/ndarray/type.Array2.html).

### [From csv](https://github.com/procyon-rs/vega_lite_3.rs/blob/master/examples/from_csv.rs)
```bash
cargo run --example from_csv
```
Loads data directly from a `csv` without deserializing to a `struct`.

### [From url](https://github.com/procyon-rs/vega_lite_3.rs/blob/master/examples/from_url.rs)
```bash
cargo run --example from_url
```
Loads data directly from an URL.

### [From JSON spec](https://github.com/procyon-rs/vega_lite_3.rs/blob/master/examples/from_json_spec.rs)
```bash
cargo run --example from_json_spec
```
Load the chart directly from the JSON spec.

### [From JSON spec with new Data](https://github.com/procyon-rs/vega_lite_3.rs/blob/master/examples/from_mixed_json_rust.rs)
```bash
cargo run --example from_mixed_json_rust
```
Create a chart from existing json and add new data

### [From nalgebra](https://github.com/procyon-rs/vega_lite_3.rs/blob/master/examples/from_nalgebra.rs)
```rust
cargo run --example from_nalgebra --features nalgebra
```
Loads data directly from a random [`nalgebra::Matrix`](https://docs.rs/nalgebra/0.19.0/nalgebra/index.html).
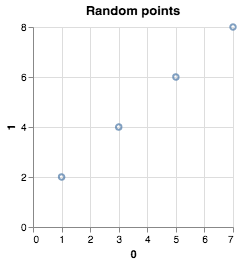
### [From rulinalg](https://github.com/procyon-rs/vega_lite_3.rs/blob/master/examples/from_ndarray.rs)
```rust
cargo run --example from_rulinalg --features rulinalg
```
Loads data directly from a random [`rulinalg::matrix::Matrix`](https://athemathmo.github.io/rulinalg/doc/rulinalg/matrix/struct.Matrix.html).

### [From nalgebra](https://github.com/procyon-rs/vega_lite_3.rs/blob/master/examples/from_nalgebra.rs)
```rust
cargo run --example from_nalgebra --features nalgebra
```
Loads data directly from a random [`nalgebra::Matrix`](https://docs.rs/nalgebra/0.19.0/nalgebra/index.html).
 ### [From rulinalg](https://github.com/procyon-rs/vega_lite_3.rs/blob/master/examples/from_ndarray.rs)
```rust
cargo run --example from_rulinalg --features rulinalg
```
Loads data directly from a random [`rulinalg::matrix::Matrix`](https://athemathmo.github.io/rulinalg/doc/rulinalg/matrix/struct.Matrix.html).
 ## Miscellaneous
### [Without using builders](https://github.com/procyon-rs/vega_lite_3.rs/blob/master/examples/without_builders.rs)
```bash
cargo run --example without_builders
```
Build a graph without using the builders. This is not the recommended way as it's more verbose and expose more the
internal structures and types, but it's possible when wanting to avoid `Result`s produced by the Builders.

## Miscellaneous
### [Without using builders](https://github.com/procyon-rs/vega_lite_3.rs/blob/master/examples/without_builders.rs)
```bash
cargo run --example without_builders
```
Build a graph without using the builders. This is not the recommended way as it's more verbose and expose more the
internal structures and types, but it's possible when wanting to avoid `Result`s produced by the Builders.

 ### [From rulinalg](https://github.com/procyon-rs/vega_lite_3.rs/blob/master/examples/from_ndarray.rs)
```rust
cargo run --example from_rulinalg --features rulinalg
```
Loads data directly from a random [`rulinalg::matrix::Matrix`](https://athemathmo.github.io/rulinalg/doc/rulinalg/matrix/struct.Matrix.html).
 ## Miscellaneous
### [Without using builders](https://github.com/procyon-rs/vega_lite_3.rs/blob/master/examples/without_builders.rs)
```bash
cargo run --example without_builders
```
Build a graph without using the builders. This is not the recommended way as it's more verbose and expose more the
internal structures and types, but it's possible when wanting to avoid `Result`s produced by the Builders.

## Miscellaneous
### [Without using builders](https://github.com/procyon-rs/vega_lite_3.rs/blob/master/examples/without_builders.rs)
```bash
cargo run --example without_builders
```
Build a graph without using the builders. This is not the recommended way as it's more verbose and expose more the
internal structures and types, but it's possible when wanting to avoid `Result`s produced by the Builders.
