bandwidthmon
| Crates.io | bandwidthmon |
| lib.rs | bandwidthmon |
| version | 0.1.14 |
| created_at | 2025-12-10 07:54:51.408121+00 |
| updated_at | 2025-12-11 09:17:00.110602+00 |
| description | Real-time network bandwidth monitor with beautiful ASCII charts |
| homepage | https://github.com/cumulus13/bandwidthmon |
| repository | https://github.com/cumulus13/bandwidthmon |
| max_upload_size | |
| id | 1977659 |
| size | 398,424 |
 cumulus13 (cumulus13)
documentation
README
bandwidthmon

![]()
![]()
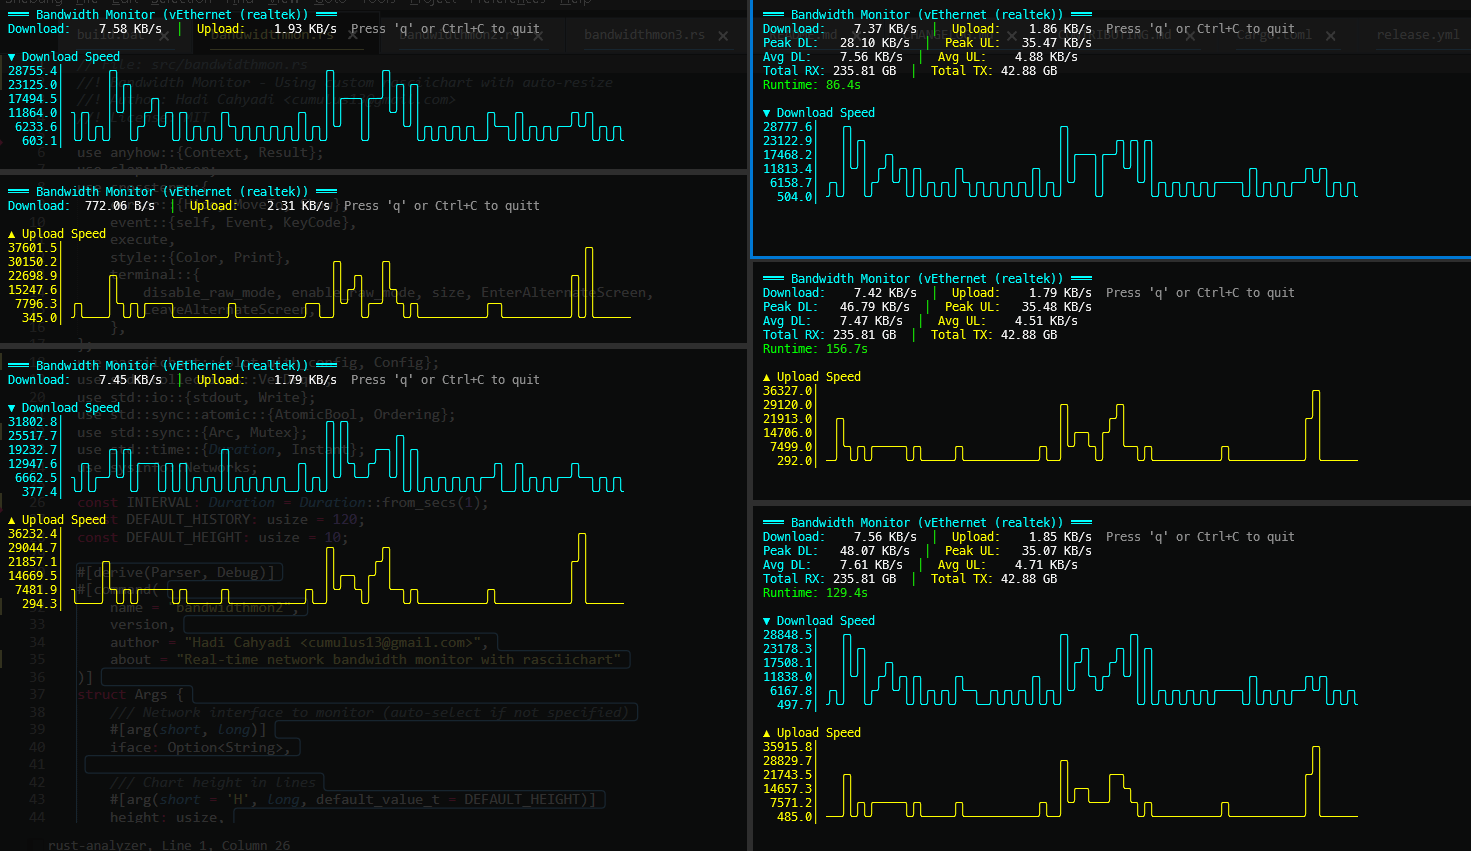
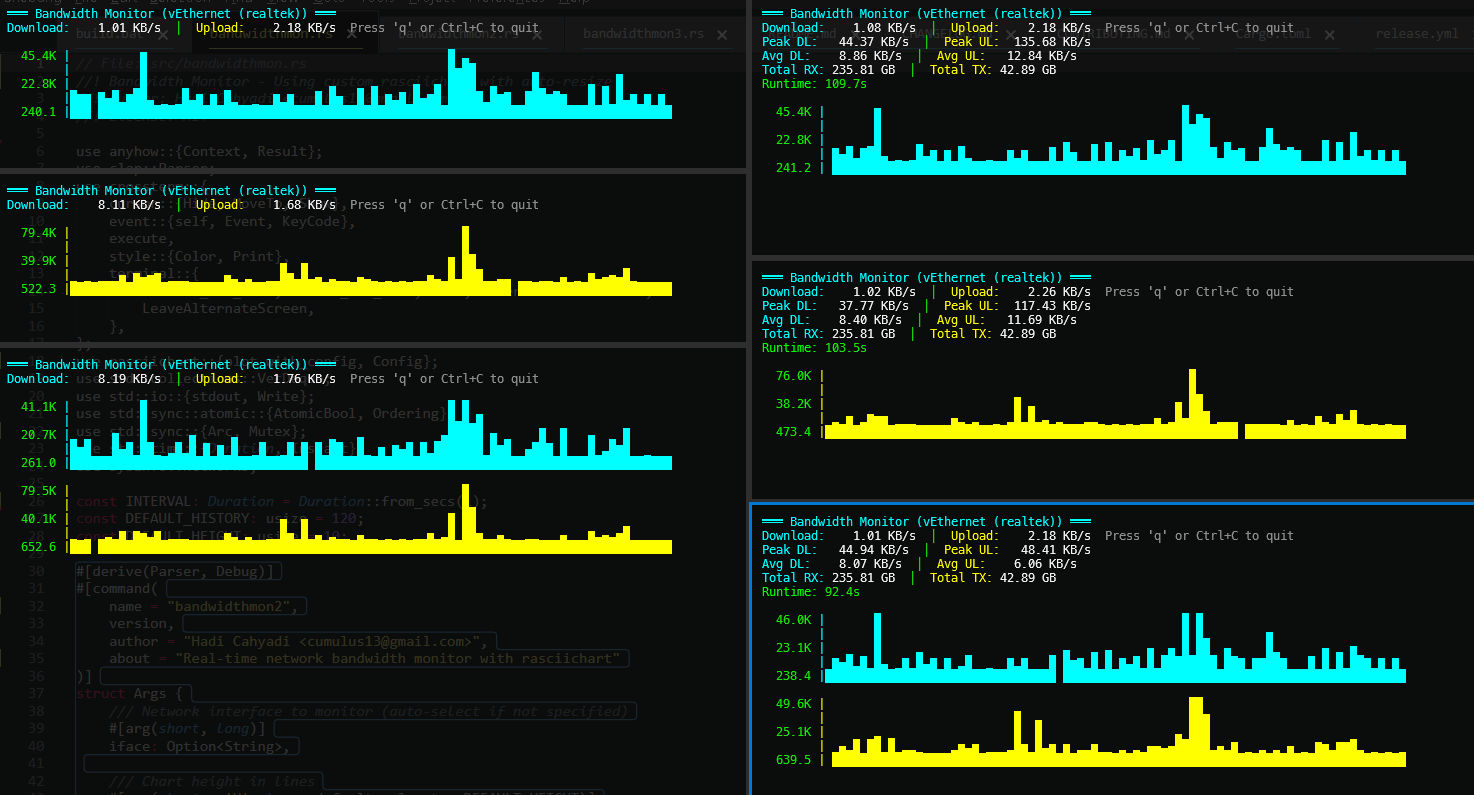
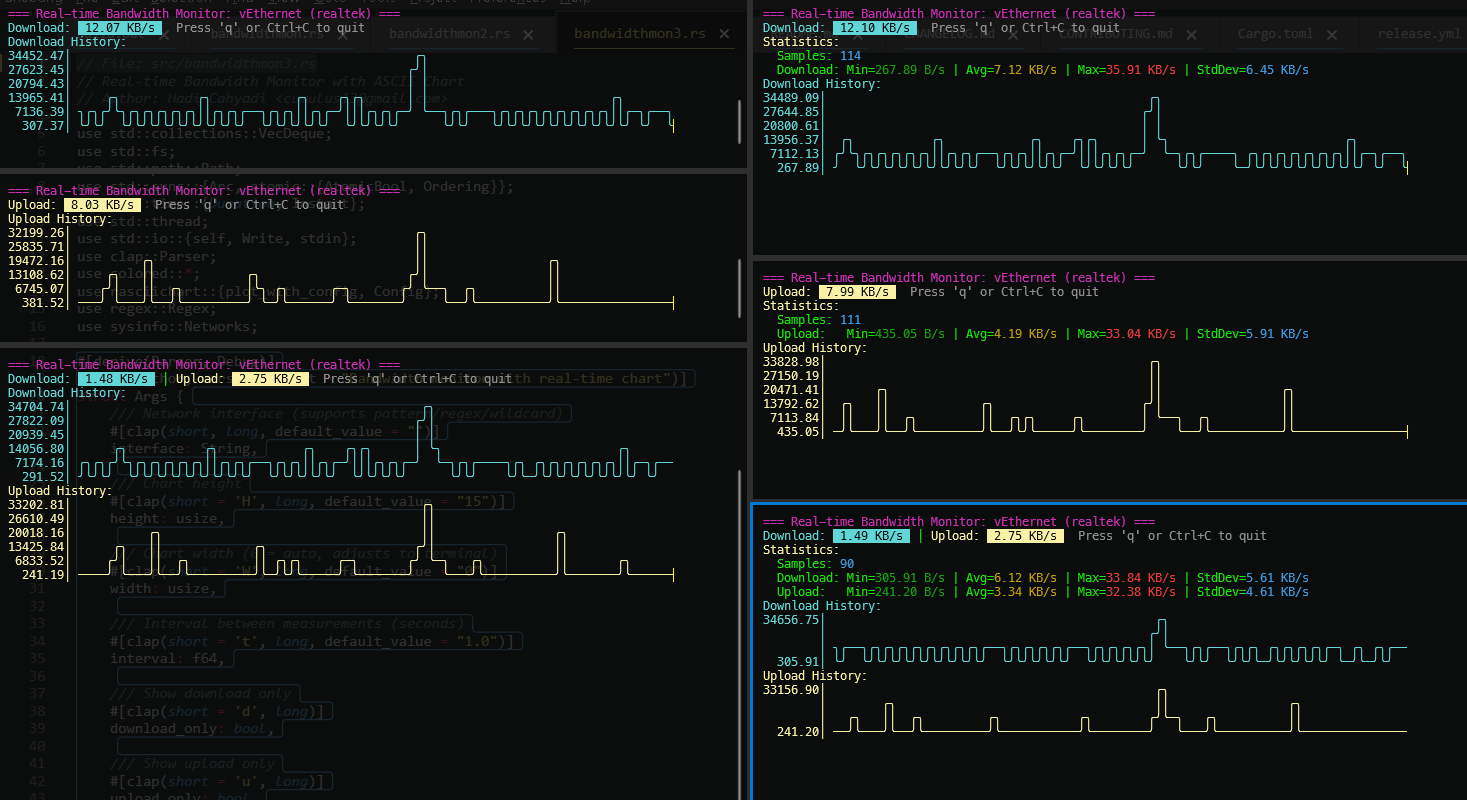
Real-time network bandwidth monitor with beautiful ASCII charts for the terminal.
Features
- 📊 Beautiful ASCII Charts - Smooth line rendering with box-drawing characters
- 🎯 Two Versions - Choose between
rasciichartlibrary or manual rendering - ⚡ Real-time Monitoring - Live bandwidth statistics with 1-second updates
- 🔍 Smart Interface Matching - Partial and case-insensitive interface names
- 📈 Statistics - Track peak, average, and total bandwidth usage
- 🎨 Colorful Output - Color-coded download/upload charts
- ⌨️ Interactive - Keyboard controls for easy navigation
- 🔍 Flexible Filtering - Show download only, upload only, or both
- 📱 Auto-sizing - Charts automatically fit your terminal width
- 🌐 Cross-platform - Works on Windows, Linux, macOS, and BSD
Installation
cargo install bandwidthmon
Or build from source:
git clone https://github.com/cumulus13/bandwidthmon
cd bandwidthmon
cargo build --release
Usage
bandwidthmon (using rasciichart)
# Auto-select best interface
bandwidthmon

# Monitor specific interface (supports partial matching!)
bandwidthmon -i eth0
bandwidthmon -i realtek    # Matches "vEthernet (realtek)" on Windows
bandwidthmon -i wlan       # Matches "wlan0" on Linux

# Custom chart size
bandwidthmon -H 15 -W 100

# Show summary statistics
bandwidthmon -s

# Show download only
bandwidthmon -d

# Show upload only
bandwidthmon -u

# List available interfaces
bandwidthmon -l
bandwidthmon2 (manual rendering)
Same arguments as bandwidthmon, but uses manual graph rendering:
bandwidthmon2 -i wlan0 -H 20 -s
bandwidthmon3 (other version rasciichart)
Same arguments as bandwidthmon, but uses manual less color:
bandwidthmon3 -i wlan0 -H 20 -s
Command-line Options
Options:
  -i, --iface <IFACE>      Network interface to monitor (auto-select if not specified)
  -H, --height <HEIGHT>    Chart height in lines [default: 10]
  -W, --width <WIDTH>      Chart width in columns (auto-fit terminal if 0) [default: 0]
  -l, --list               List available network interfaces
  -s, --summary            Show summary statistics
  -d, --download           Show download chart only
  -u, --upload             Show upload chart only
      --history <HISTORY>  Maximum history points [default: 120]
  -h, --help               Print help
  -V, --version            Print version
Keyboard Controls
qorQ- QuitEsc- QuitCtrl+C- Quit
Summary Statistics
Use -s or --summary to show additional statistics:
- Peak DL/UL - Maximum download/upload speeds
- Avg DL/UL - Average download/upload speeds
- Total RX/TX - Total bytes received/transmitted
- Runtime - Monitoring session duration
Dependencies
sysinfo- System and network informationcrossterm- Terminal manipulationrasciichart- ASCII chart rendering (bandwidthmon only)clap- Command-line argument parsinganyhow- Error handling
Platform Support
- ✅ Linux
- ✅ macOS
- ✅ Windows
- ✅ BSD
Performance
- Minimal CPU usage (~0.5%)
- Low memory footprint (~5 MB)
- Configurable history size for memory optimization
License
MIT License - see LICENSE file for details
Author
Hadi Cahyadi
- Email: cumulus13@gmail.com
- GitHub: cumulus13


Contributing
Contributions are welcome! Please feel free to submit a Pull Request.
Related Projects
- rasciichart - ASCII chart library for Rust
FAQ
Q: How do I monitor multiple interfaces?
A: Run multiple instances in different terminals with -i for each interface.
Q: Can I export the data?
A: Currently, the tool is for real-time monitoring only. Export functionality may be added in future versions.
Q: The chart looks weird on my terminal
A: Ensure your terminal supports UTF-8 and box-drawing characters. Try a modern terminal like Alacritty, iTerm2, or Windows Terminal.
Support
If you encounter any issues or have suggestions, please open an issue on GitHub.