cas-graph
| Crates.io | cas-graph |
| lib.rs | cas-graph |
| version | 0.2.0 |
| created_at | 2025-04-15 22:37:57.951847+00 |
| updated_at | 2025-05-21 01:30:48.656514+00 |
| description | A customizable graphing calculator for CalcScript |
| homepage | |
| repository | https://github.com/ElectrifyPro/cas-rs |
| max_upload_size | |
| id | 1635357 |
| size | 282,596 |
 (ElectrifyPro)
documentation
README
A customizable graphing calculator for CalcScript.
Usage
Creating a graph is as simple as creating a [Graph] object, adding expressions
and points with [Graph::add_expr] / [Graph::try_add_expr] and
[Graph::add_point], and finally calling [Graph::draw]. The result can be
written to a file in PNG and SVG format.
See the module-level documentation for more information.
Example
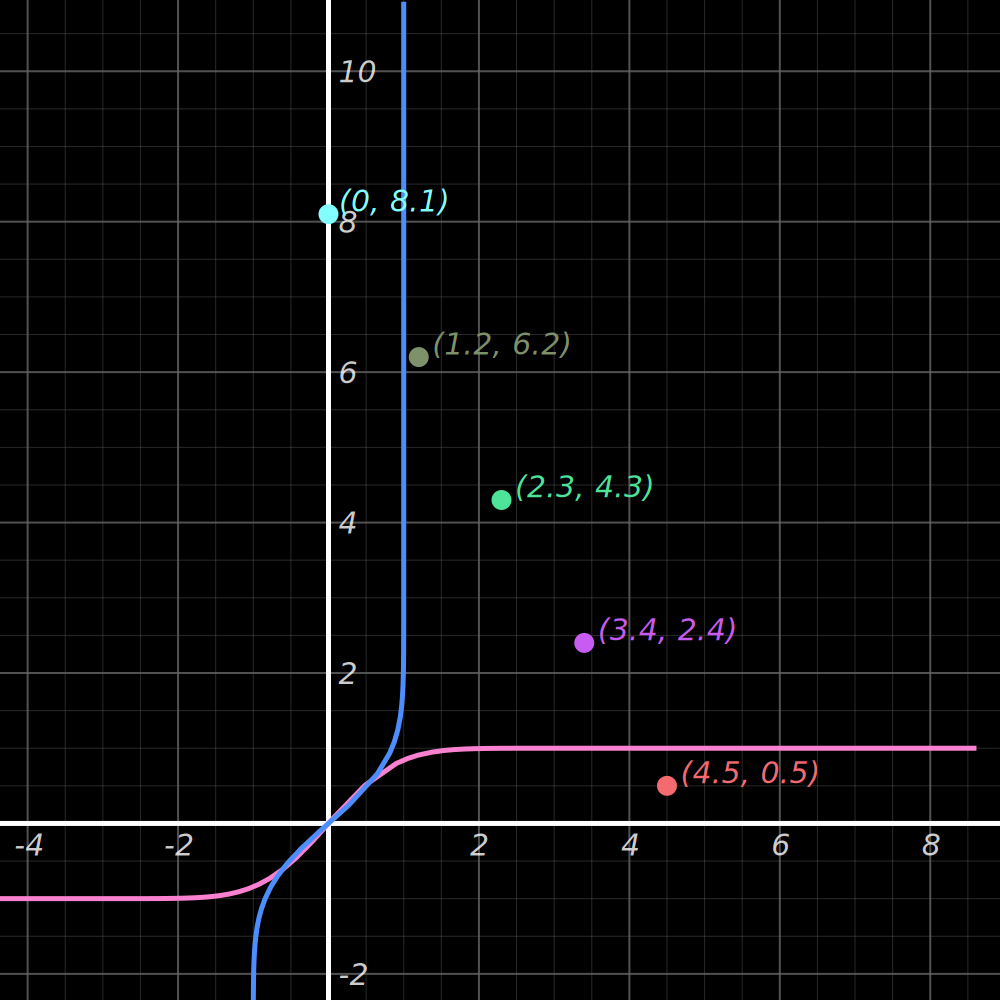
Graph the expressions x = erf(y) and y = erf(x) with the viewport centered
on the points (0, 8.1), (1.2, 6.2), (2.3, 4.3), (3.4, 2.4), and (4.5, 0.5), then write the result to erf-output.png:
use cas_graph::Graph;
use std::fs::File;

fn main() -> Result<(), Box<dyn std::error::Error>> {
    let surface = Graph::default()
        .try_add_expr("erf(y)").unwrap()
        .try_add_expr("erf(x)").unwrap()
        .add_point((0.0, 8.1))
        .add_point((1.2, 6.2))
        .add_point((2.3, 4.3))
        .add_point((3.4, 2.4))
        .add_point((4.5, 0.5))
        .center_on_points()
        .draw()?;

    let mut file = File::create("erf-output.png")?;
    surface.write_to_png(&mut file)?;

    Ok(())
}
Output (note: colors were randomly chosen; random color selection is not included in the example code):