db-dump
| Crates.io | db-dump |
| lib.rs | db-dump |
| version | 0.7.14 |
| created_at | 2021-03-16 22:49:30.618111+00 |
| updated_at | 2025-11-27 19:23:08.721508+00 |
| description | Library for scripting analyses against crates.io's database dumps |
| homepage | |
| repository | https://github.com/dtolnay/db-dump |
| max_upload_size | |
| id | 369986 |
| size | 310,393 |
 Lanthanum (github:zxtn:lanthanum)
documentation
https://docs.rs/db-dump
README
crates.io database dumps
![]()
Library for scripting analyses against crates.io's database dumps.
These database dumps contain all information exposed by the crates.io API packaged into a single download. An updated dump is published every 24 hours. The latest dump is available at https://static.crates.io/db-dump.tar.gz.
Examples
The examples/ directory of this repo contains several runnable example analyses.
| total‑downloads | Computes time series of total downloads by day across all crates on crates.io |
|---|---|
| crate‑downloads | Computes time series of downloads of one specific crate |
| top‑crates | Computes the top few most directly depended upon crates |
| user‑dependencies | Computes the percentage of crates.io which depends directly on at least one crate by the specified user |
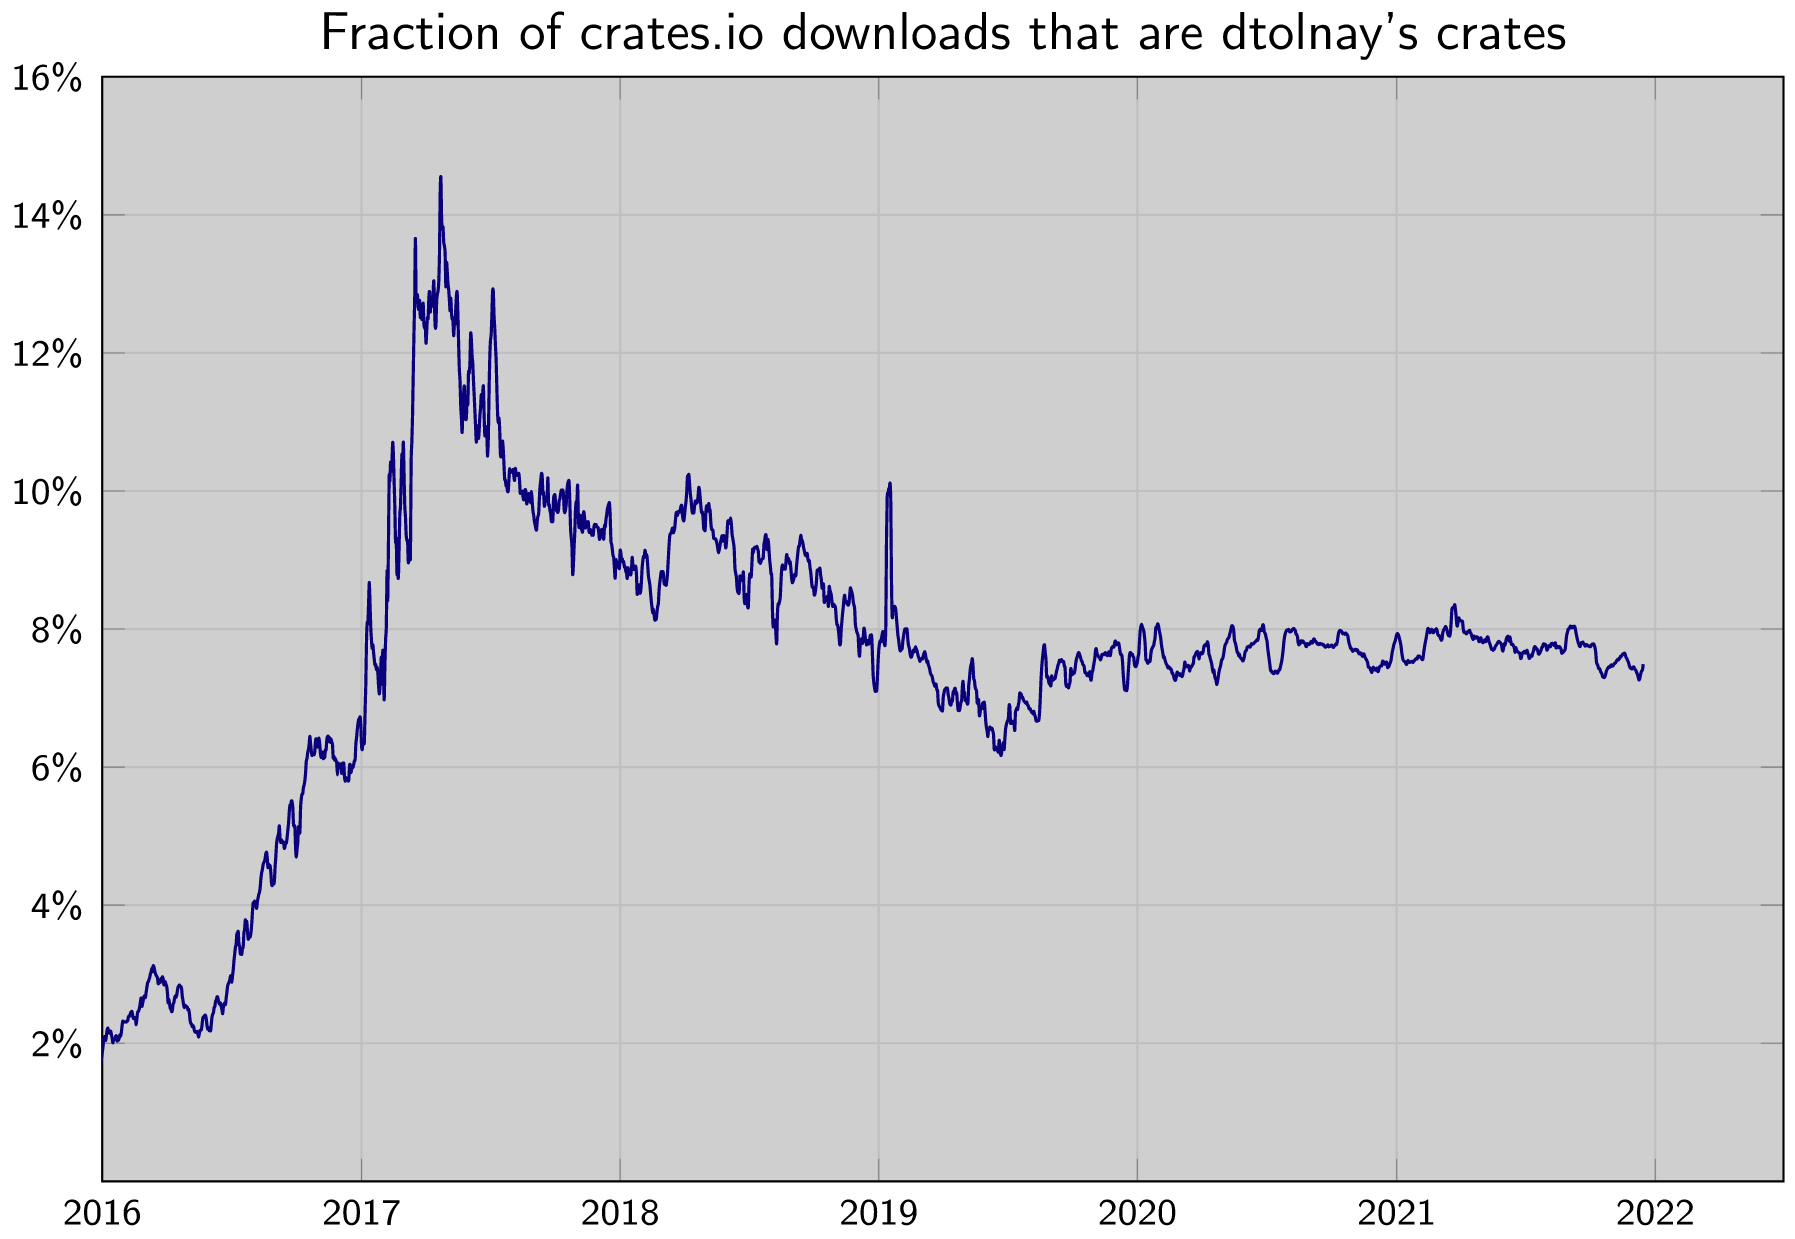
| user‑downloads | Computes time series of the fraction of crates.io downloads attributed to a single given user's crates |
Each of these examples can be run using Cargo once you've downloaded a recent database dump:
$ wget https://static.crates.io/db-dump.tar.gz
$ cargo run --release --example total-downloads
Here is the implementation of the most basic example, total-downloads, and graph of the resulting table. It shows crates.io download rate doubling every 9 months, or equivalently 10× every 2.5 years!
use chrono::Utc;
use db_dump::Date;
use std::collections::BTreeMap as Map;

fn main() -> db_dump::Result<()> {
    let mut downloads = Map::<Date<Utc>, u64>::new();
    db_dump::Loader::new()
        .version_downloads(|row| {
            *downloads.entry(row.date).or_default() += row.downloads;
        })
        .load("./db-dump.tar.gz")?;

    for (date, count) in downloads {
        println!("{},{}", date, count);
    }

    Ok(())
}
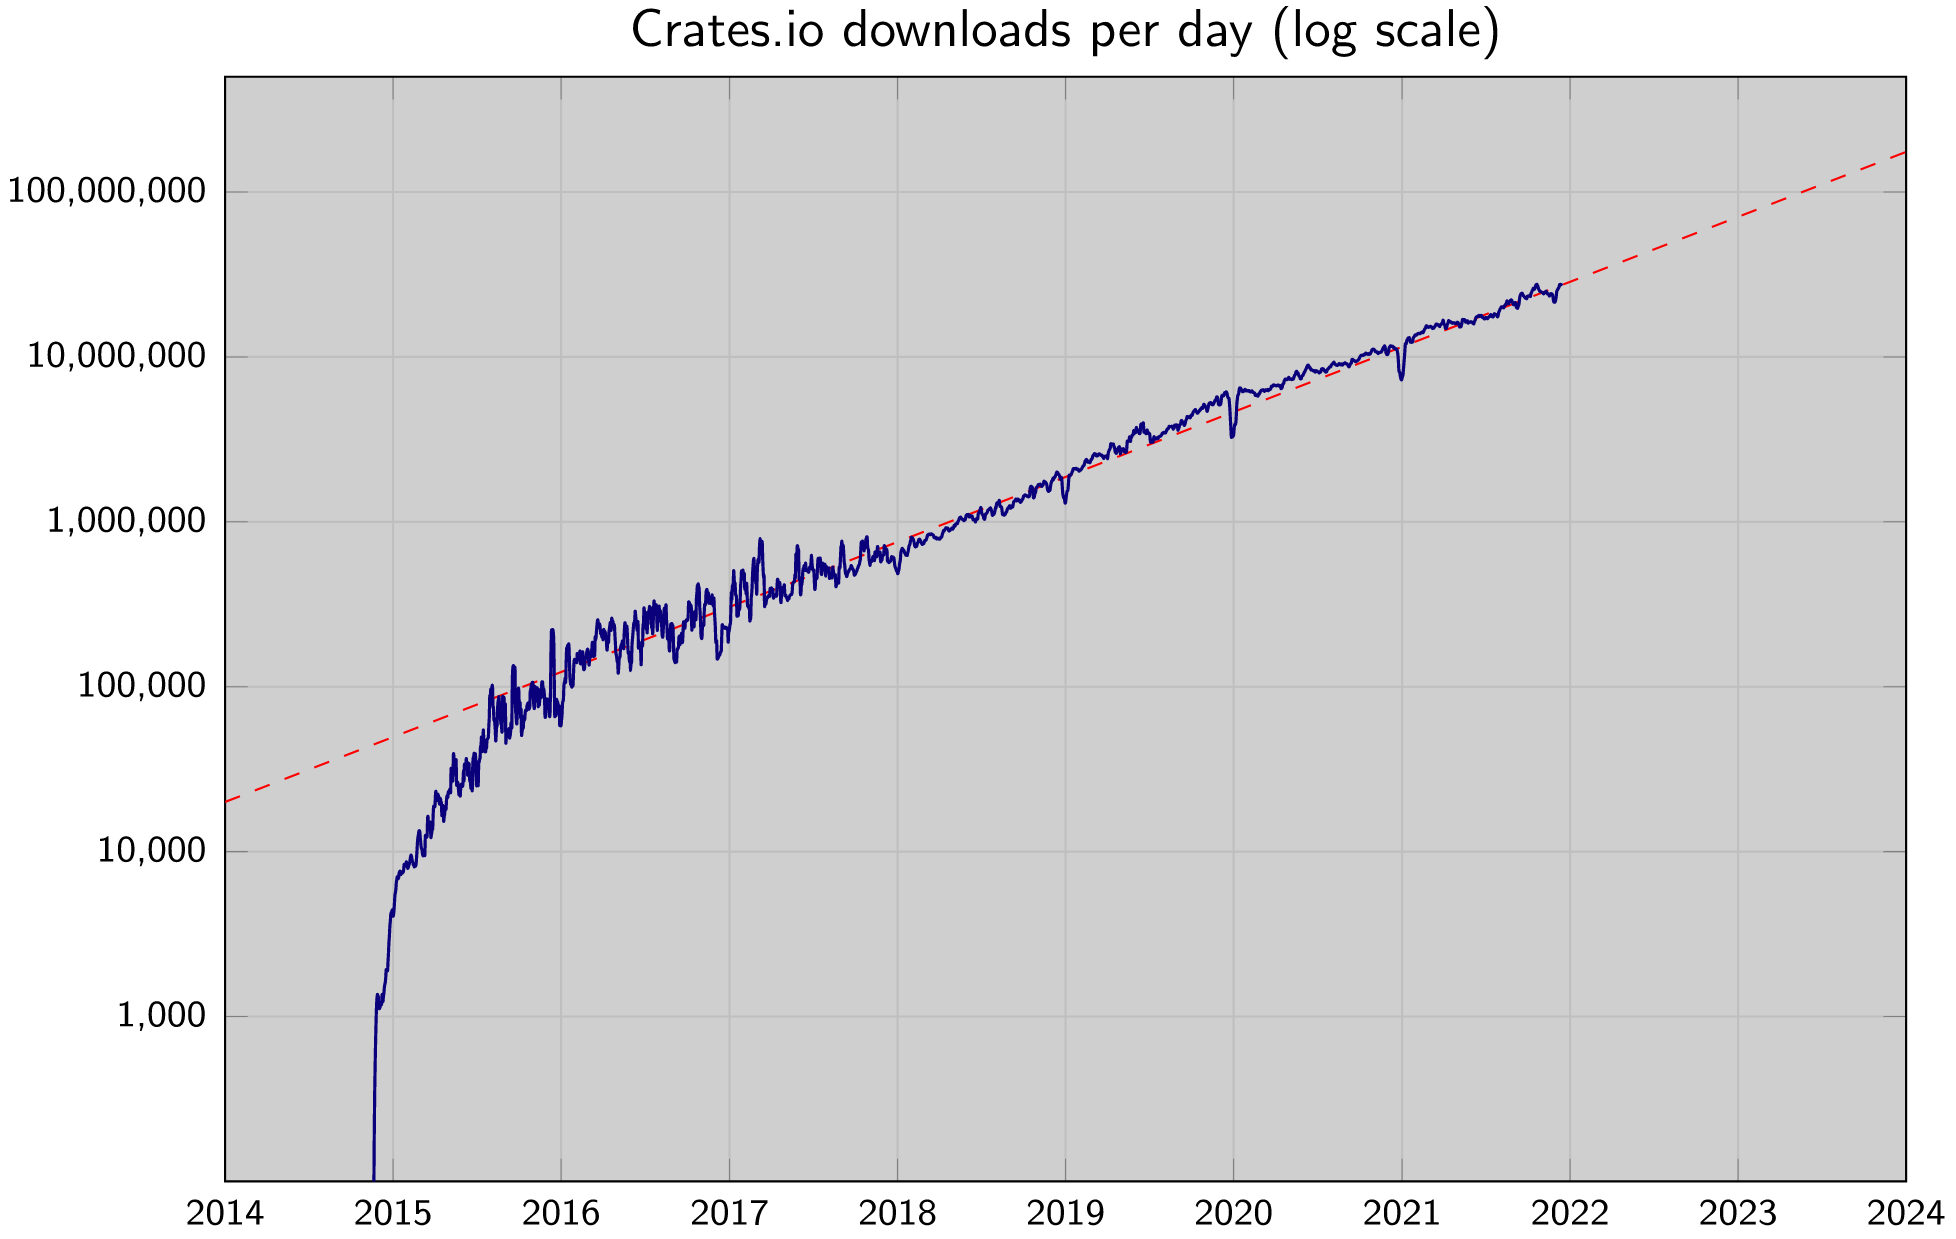
Here is a graph from the user-downloads example:
License
Licensed under either of Apache License, Version 2.0 or MIT license at your option.Unless you explicitly state otherwise, any contribution intentionally submitted for inclusion in this crate by you, as defined in the Apache-2.0 license, shall be dual licensed as above, without any additional terms or conditions.