dear-implot
| Crates.io | dear-implot |
| lib.rs | dear-implot |
| version | 0.8.0 |
| created_at | 2025-09-13 17:32:30.731466+00 |
| updated_at | 2026-01-02 18:11:32.494086+00 |
| description | High-level Rust bindings to ImPlot with dear-imgui-rs integration |
| homepage | https://github.com/Latias94/dear-imgui-rs |
| repository | https://github.com/Latias94/dear-imgui-rs |
| max_upload_size | |
| id | 1837951 |
| size | 272,965 |
 Latias94 (Latias94)
documentation
README
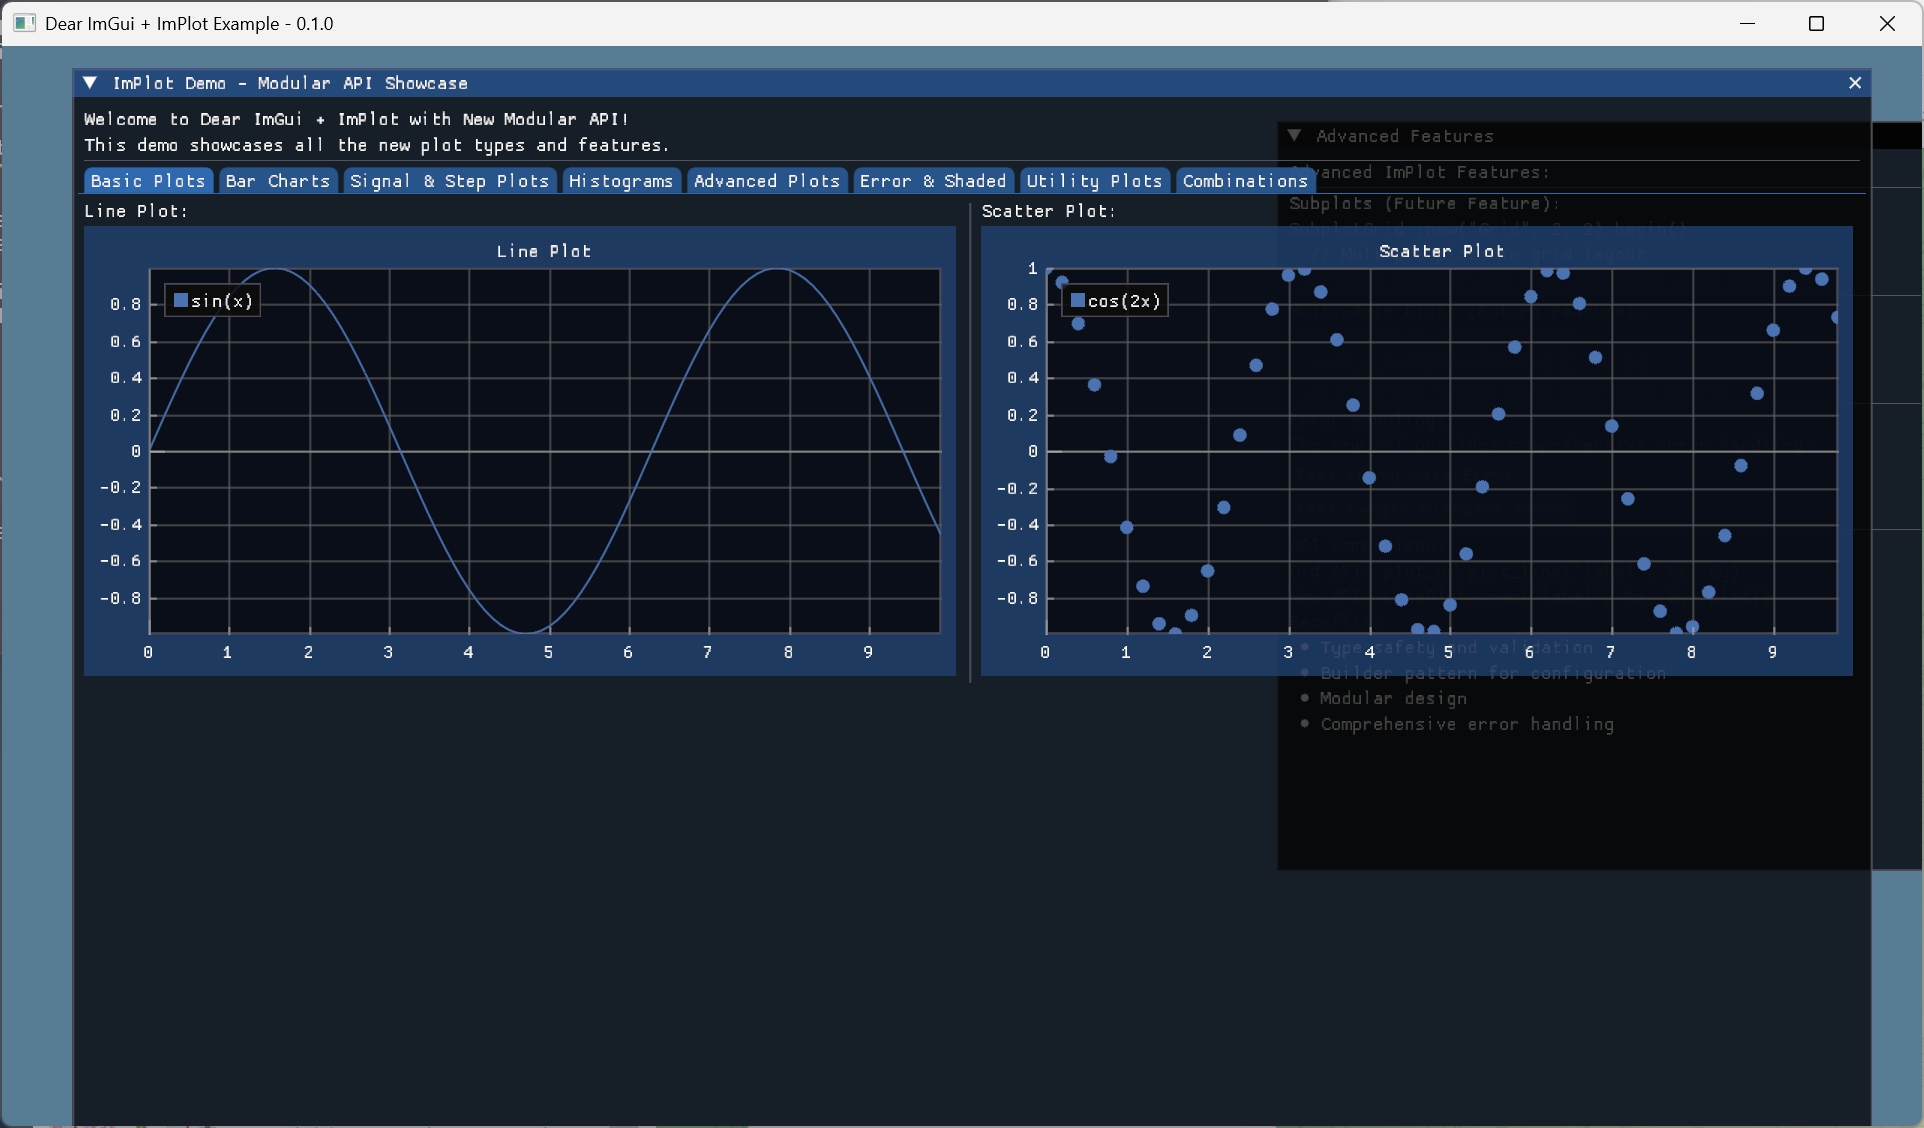
Dear ImPlot - Rust Bindings

![]()
High-level Rust bindings for ImPlot, the immediate mode plotting library. This crate provides safe, idiomatic Rust bindings designed to work seamlessly with dear-imgui-rs (which uses cimgui C API) and dear-implot-sys (which uses cimplot C API).
For native build/link options (source, system/prebuilt, remote prebuilt), see extensions/dear-implot-sys/README.md.
Links
- Upstream: https://github.com/epezent/implot
- C API: https://github.com/cimgui/cimplot
Compatibility
| Item | Version |
|---|---|
| Crate | 0.8.x |
| dear-imgui-rs | 0.8.x |
| dear-implot-sys | 0.8.x |
WASM (WebAssembly) support
This crate has experimental support for wasm32-unknown-unknown targets via the same import-style design used by the core ImGui bindings:
dear-implot+dear-implot-sysexpose awasmfeature which:- Enables import-style FFI that links against the shared
imgui-sys-v0provider module. - Avoids compiling C/C++ during the Rust build for wasm.
- Enables import-style FFI that links against the shared
- The provider module (
imgui-sys-v0) is built once using Emscripten and contains:- Dear ImGui + cimgui (from
dear-imgui-sys) - ImPlot + cimplot (from
dear-implot-sys)
- Dear ImGui + cimgui (from
To try the web demo with ImPlot enabled:
# 1) Generate pregenerated wasm bindings (Dear ImGui core + ImPlot)
cargo run -p xtask -- wasm-bindgen imgui-sys-v0
cargo run -p xtask -- wasm-bindgen-implot imgui-sys-v0

# 2) Build the main wasm + JS (includes ImPlot demo window)
cargo run -p xtask -- web-demo implot

# 3) Build the provider (Emscripten imgui-sys-v0 with ImGui + ImPlot)
cargo run -p xtask -- build-cimgui-provider

# 4) Serve and open in a browser
python -m http.server -d target/web-demo 8080
Notes:
- The
dear-imgui-web-democrate inexamples-wasmenables theimplotfeature by default, so the “ImPlot (Web)” window is shown when ImPlot bindings + provider are available. - This is an early, experimental path; API and build steps may evolve in future releases. For production use, pin to a specific
0.6.xrelease and follow changes indocs/WASM.md.
See also: docs/COMPATIBILITY.md for the full workspace matrix.
Integration Quickstart
This crate integrates with dear-imgui-rs directly — add both crates, then build plots inside an ImGui window using a PlotContext bound to the current ImGui context.
[dependencies]
dear-imgui-rs = "0.8"
dear-implot = "0.8"
use dear_imgui as imgui;
use dear_implot::*;

fn main() {
    let mut ctx = imgui::Context::create();
    let plot_ctx = PlotContext::create(&ctx);

    // frame loop
    let ui = ctx.frame();
    // Ui extension: obtain PlotUi from Ui + PlotContext
    let plot_ui = ui.implot(&plot_ctx);
    ui.window("Plot Example").build(|| {
        if let Some(token) = plot_ui.begin_plot("Line") {
            let x = [0.0, 1.0, 2.0, 3.0];
            let y = [0.0, 1.0, 4.0, 9.0];
            LinePlot::new("y=x^2", &x, &y).plot();
            token.end();
        }
    });
}
Notes:
- Base ImGui static library linking is handled by
dear-imgui-sys; you do not need to link it here. - Refer to the
-sysREADME forIMPLOT_SYS_*env vars when using prebuilt libraries.
Features
- Safe, idiomatic Rust API - Memory-safe interfaces with proper lifetime management
- Full compatibility with dear-imgui - Uses the same context management patterns
- Builder pattern for plots - Fluent, ergonomic API for creating plots
- Comprehensive plot types - Support for all major plot types including:
- Line plots and scatter plots
- Bar charts and histograms (1D and 2D)
- Heatmaps and pie charts
- Error bars and shaded plots
- Stem plots and more
- Advanced features - Subplots, multi-axis plots, and legend management
- Modular design - Each plot type is in its own module for better organization
- Universal plot builder - Unified API for creating any plot type
Quick Start
Add to your Cargo.toml:
[dependencies]
dear-imgui-rs = "0.8"
dear-implot = "0.8"
Basic usage:
use dear_imgui_rs::*;
use dear_implot::*;

fn main() -> Result<(), Box<dyn std::error::Error>> {
    let mut ctx = Context::create();
    let plot_ctx = PlotContext::create(&ctx);

    // In your main loop:
    let ui = ctx.frame();
    // Or via Ui extension:
    let plot_ui = ui.implot(&plot_ctx);

    ui.window("My Plots")
        .size([800.0, 600.0], Condition::FirstUseEver)
        .build(|| {
            if let Some(token) = plot_ui.begin_plot("Line Plot") {
                let x_data = [0.0, 1.0, 2.0, 3.0, 4.0];
                let y_data = [0.0, 1.0, 4.0, 9.0, 16.0];

                // New modular API
                LinePlot::new("Quadratic", &x_data, &y_data).plot();

                token.end();
            }
        });

    Ok(())
}
Plot Types
Line and Scatter Plots
// Line plot
LinePlot::new("My Line", &x_data, &y_data).plot();

// Scatter plot
ScatterPlot::new("My Points", &x_data, &y_data).plot();
Bar Charts
// Simple bar chart
BarPlot::new("Bars", &values)
    .with_bar_size(0.8)
    .plot();

// Positional bar chart
PositionalBarPlot::new("Positioned Bars", &x_positions, &values)
    .with_bar_size(0.5)
    .plot();
Histograms
// 1D Histogram
HistogramPlot::new("Distribution", &data)
    .with_bins(20)
    .density()
    .cumulative()
    .plot();

// 2D Histogram
Histogram2DPlot::new("2D Distribution", &x_data, &y_data)
    .with_bins(10, 10)
    .plot();
Heatmaps
let data: Vec<f64> = (0..100).map(|i| (i as f64 * 0.1).sin()).collect();

HeatmapPlot::new("Heat", &data, 10, 10)
    .with_scale(-1.0, 1.0)
    .with_bounds(0.0, 0.0, 1.0, 1.0)
    .with_label_format("%.2f")
    .plot();
Pie Charts
let labels = vec!["A", "B", "C", "D"];
let values = [0.25, 0.35, 0.20, 0.20];

PieChartPlot::new(labels, &values, 0.5, 0.5, 0.4)
    .normalize()
    .exploding()
    .with_angle0(90.0)
    .plot();
Error Bars
let errors = [0.1, 0.2, 0.15, 0.3, 0.25];

ErrorBarsPlot::new("Measurements", &x_data, &y_data, &errors)
    .horizontal()
    .plot();
Shaded Plots
// Shaded area plot
ShadedPlot::new("Area", &x_data, &y_data)
    .with_y_ref(0.0)
    .plot();

// Shaded between two curves
ShadedBetweenPlot::new("Between", &x_data, &y1_data, &y2_data)
    .plot();
Advanced Features
Subplots
if let Ok(token) = SubplotGrid::new("My Subplots", 2, 2)
    .with_size([800.0, 600.0])
    .with_flags(SubplotFlags::NONE)
    .begin() {

    // First subplot
    if let Some(plot_token) = plot_ui.begin_plot("") {
        LinePlot::new("Line", &x_data, &y_data).plot();
        plot_token.end();
    }

    // Second subplot
    if let Some(plot_token) = plot_ui.begin_plot("") {
        BarPlot::new("Bars", &values).plot();
        plot_token.end();
    }

    // ... more subplots

    token.end();
}
Multi-Axis Plots
let mut multi_plot = MultiAxisPlot::new("Multi-Axis")
    .add_y_axis(YAxisConfig {
        label: Some("Temperature (°C)"),
        flags: AxisFlags::NONE,
        range: Some((-10.0, 40.0)),
    })
    .add_y_axis(YAxisConfig {
        label: Some("Pressure (hPa)"),
        flags: AxisFlags::NONE,
        range: Some((900.0, 1100.0)),
    });

if let Ok(token) = multi_plot.begin() {
    // Plot on first Y-axis
    token.set_y_axis(0);
    LinePlot::new("Temperature", &time, &temp).plot();

    // Plot on second Y-axis
    token.set_y_axis(1);
    LinePlot::new("Pressure", &time, &pressure).plot();

    token.end();
}
Universal Plot Builder
Axis Setup & Selection
// Inside an active plot (between begin_plot/end)
// Configure axes labels/flags
plot_ui.setup_axes(Some("Time (s)"), Some("Value"), AxisFlags::NO_GRID_LINES, AxisFlags::NONE);

// Set explicit ticks on X1
let tick_pos = [0.0, 1.0, 2.0, 3.0];
let tick_lbl = ["0s", "1s", "2s", "3s"];
plot_ui.setup_x_axis_ticks_positions(XAxis::X1, &tick_pos, Some(&tick_lbl), true);

// Format Y1 ticks
plot_ui.setup_y_axis_format(YAxis::Y1, "%.2f");

// Apply limits
plot_ui.setup_axes_limits(0.0, 3.0, -1.0, 1.0, PlotCond::Once);

// Selection query
if dear_implot::utils::is_plot_selected() {
    if let Some(rect) = dear_implot::utils::get_plot_selection_axes(XAxis::X1, YAxis::Y1) {
        // rect.X.Min/Max, rect.Y.Min/Max
    }
}
Infinite Lines & Image
// Infinite lines
plot_ui.inf_lines_vertical("vlines", &[1.0, 2.0, 3.0])?;
plot_ui.inf_lines_horizontal("hlines", &[0.0])?;

// Image plot (using ImTextureID)
let bounds_min = ImPlotPoint { x: 0.0, y: 0.0 };
let bounds_max = ImPlotPoint { x: 1.0, y: 1.0 };
plot_ui.plot_image("image", my_tex_id, bounds_min, bounds_max)?;
For a more unified API, you can use the PlotBuilder:
// Line plot
PlotBuilder::line("My Line", &x_data, &y_data).build()?;

// Bar plot
PlotBuilder::bar("My Bars", &values).build()?;

// Histogram
PlotBuilder::histogram("Distribution", &data).build()?;

// Heatmap
PlotBuilder::heatmap("Heat", &data, 10, 10).build()?;
Error Handling
All plot functions return Result<(), PlotError> for proper error handling:
match LinePlot::new("My Plot", &x_data, &y_data).validate() {
    Ok(_) => {
        // Plot is valid, proceed
        LinePlot::new("My Plot", &x_data, &y_data).plot();
    }
    Err(PlotError::DataLengthMismatch { expected, actual }) => {
        eprintln!("Data length mismatch: expected {}, got {}", expected, actual);
    }
    Err(PlotError::EmptyData) => {
        eprintln!("Cannot plot empty data");
    }
    Err(e) => {
        eprintln!("Plot error: {}", e);
    }
}
Integration with Dear ImGui
This crate is designed to work seamlessly with the dear-imgui ecosystem:
- Uses the same context management patterns as dear-imgui
- Compatible with dear-imgui's UI tokens and lifetime management
- Shares the same underlying Dear ImGui context
- Follows the same safety and ergonomics principles
Examples
See the examples/ directory for complete working examples:
plot_gallery.rs- Comprehensive showcase of all plot typesadvanced_features.rs- Subplots and multi-axis examplesreal_time_plotting.rs- Dynamic data visualization
Building
This crate requires:
- Rust 1.70 or later
- C++ compiler (for building ImPlot)
- CMake (for building dependencies)
The build process automatically handles:
- Building ImPlot from source
- Generating C++ wrapper functions
- Linking with dear-imgui
Architecture
This crate follows the same architectural patterns as dear-imgui-rs:
- Context Management: Separate ImPlot context that works alongside Dear ImGui
- Lifetime Safety: Plot tokens ensure proper begin/end pairing
- RAII: Automatic cleanup of resources and style stacks
- Builder Patterns: Fluent APIs for configuration
- Modular Design: Each plot type is in its own module
License
This project is licensed under the MIT License - see the LICENSE file for details.
Contributing
Contributions are welcome! Please feel free to submit a Pull Request.