httpwsrep
| Crates.io | httpwsrep |
| lib.rs | httpwsrep |
| version | 1.1.2 |
| created_at | 2018-12-03 15:41:36.119506+00 |
| updated_at | 2022-03-02 19:25:41.361197+00 |
| description | HTTP status codes for Galera cluster |
| homepage | https://github.com/nbari/httpwsrep |
| repository | https://github.com/nbari/httpwsrep |
| max_upload_size | |
| id | 99860 |
| size | 68,473 |
documentation
https://github.com/nbari/httpwsrep/blob/master/README.md
README
httpwsrep
HTTP status codes for galera cluster
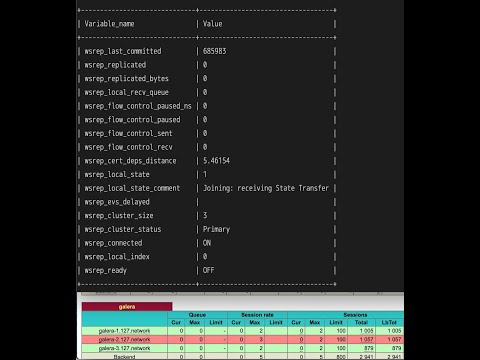
This helps to check the galera cluster using HAProxy - option httpchk
which queries the galera node and gets its current state from:
SHOW STATUS LIKE 'wsrep_local_state';
if wsrep_local_state == 4 it will return HTTP 200 OK, otherwise
HTTP 503 Service Unavailable
The posible values for wsrep_local_state are:
| Num | Comment | Description |
|---|---|---|
| 1 | Joining | Node is joining the cluster |
| 2 | Donor/Desynced | Node is the donor to the node joining the cluster |
| 3 | Joined | Node has joined the cluster |
| 4 | Synced | Node is synced with the cluster |
HAProxy example
backend galera
    mode tcp
    option httpchk
    default-server check port 9200
    server node0 10.0.0.1:3306
    server node1 10.0.0.2:3306
    server node2 10.0.0.3:3306
httpwsrep
You need to run httpwsrep in each galera node preferably using a supervisor,
for example if using immortal you could create
/usr/local/etc/immortal/httpwsrep.yml with something like this:
cmd: /path/to/httpwsrep
env:
    DSN: mysql://haproxy@tcp(10.0.0.1:3306)/
log:
    file: /var/log/httpwsrep.log
a valid mysql user needs to be created, in this case the user is
haproxy
By default port 9200 is used but if required can change it using option --port
metrics
You can use Prometheus and query the endpoint: /metrics

