meteostat
| Crates.io | meteostat |
| lib.rs | meteostat |
| version | 0.4.6 |
| created_at | 2025-04-26 16:06:18.819306+00 |
| updated_at | 2025-10-31 17:07:13.861216+00 |
| description | Get historic weather data from thousands of weather stations around the world. |
| homepage | https://github.com/ruurdbijlsma/meteostat_rs |
| repository | https://github.com/ruurdbijlsma/meteostat_rs |
| max_upload_size | |
| id | 1650401 |
| size | 447,474 |
 Ruurd Bijlsma (RuurdBijlsma)
documentation
README
Meteostat for Rust

![]()

![]()
The Weather's Record Keeper - In Rust!
This crate provides a convenient asynchronous Rust interface for accessing historical weather and climate data from Meteostat, leveraging their publicly available bulk data interface. It allows fetching data for thousands of weather stations worldwide.
Meteostat is a free and open provider of weather & climate data. They collect, process, and provide the data. This crate is a Rust client for their bulk API. Please consider supporting Meteostat: **Donate to Meteostat **.
Access yesterday's temperatures or discover weather from centuries ago, directly from your Rust application.
Features
- Fetch by Station ID or Location: Initiate requests via frequency-specific clients (
client.hourly(),client.daily(), etc.) and specify either.station("ID")or.location(LatLon). - Find Nearby Stations: Search for stations near coordinates using
client.find_stations(), optionally filtering by distance and data availability (inventory). - Multiple Frequencies:
- Efficient Data Handling with Polars: Returns data as wrappers around Polars
LazyFrames ( e.g.,HourlyLazyFrame), enabling powerful, memory-efficient filtering and manipulation before collecting results. - Convenient Filtering: Frame wrappers provide methods for easy filtering by date, year, month, or datetime ranges (
e.g.,
daily_lazy.get_for_period(Year(2023))). - Collect to Structs or
DataFrame: Easily convert filtered data intoVec<Struct>(e.g.,Vec<Hourly>), singleStructs (e.g.,Daily), or PolarsDataFrames. - Automatic Caching: Downloads and caches station metadata and weather data files locally to speed up subsequent requests and reduce load on Meteostat's servers.
- Asynchronous: Built with
tokiofor non-blocking I/O.
Installation
Add meteostat to your Cargo.toml dependencies:
cargo add meteostat
Quick Start
Fetch hourly and daily weather data for a specific location:
use meteostat::{Meteostat, LatLon, MeteostatError, Year};
use polars::prelude::*;
use chrono::{NaiveDate};

#[tokio::main]
async fn main() -> Result<(), MeteostatError> {
    let client = Meteostat::new().await?;
    let location = LatLon(52.0836403, 5.1257283); // Example location

    // --- Example 1: Collect 24 hourly data points for a specific date into `Vec<Hourly>` ---
    let period = NaiveDate::from_ymd_opt(2023, 9, 1).unwrap();
    let hourly_vec = client
        .hourly()
        .location(location)
        .call()
        .await? // Returns `HourlyLazyFrame`
        .get_for_period(period)? // Filter for the specific date
        .collect_hourly()?; // Collects into `Vec<Hourly>`

    println!("Fetched {} hourly records.", hourly_vec.len());
    if let Some(first_record) = hourly_vec.first() {
        println!("First hourly record: {:?}", first_record);
    }

    // --- Example 2: Collect daily data for an entire year into a Polars `DataFrame` ---
    let daily_df = client
        .daily()
        .location(location)
        .call()
        .await? // Returns `DailyLazyFrame`
        .get_for_period(Year(2023))? // Filter for the year 2023
        .frame // Access the inner Polars `LazyFrame`
        .collect()?; // Collects into `polars::prelude::DataFrame`

    println!("Daily data for 2023 (DataFrame):\n{}", daily_df.head(Some(3)));

    Ok(())
}
Output
Fetched 24 hourly records.
First hourly record: Hourly { datetime: 2023-09-01T00:00:00Z, temperature: Some(12.7), dew_point: Some(12.1), relative_humidity: Some(96), precipitation: Some(0.0), snow: None, wind_direction: Some(150), wind_speed: Some(7.2), peak_wind_gust: Some(9.3), pressure: Some(1011.5), sunshine_minutes: None, condition: Some(Overcast) }
Daily data for 2023 (DataFrame):
shape: (3, 11)
┌────────────┬──────┬──────┬──────┬───┬──────┬──────┬────────┬──────┐
│ date       ┆ tavg ┆ tmin ┆ tmax ┆ … ┆ wspd ┆ wpgt ┆ pres   ┆ tsun │
│ ---        ┆ ---  ┆ ---  ┆ ---  ┆   ┆ ---  ┆ ---  ┆ ---    ┆ ---  │
│ date       ┆ f64  ┆ f64  ┆ f64  ┆   ┆ f64  ┆ f64  ┆ f64    ┆ i64  │
╞════════════╪══════╪══════╪══════╪═══╪══════╪══════╪════════╪══════╡
│ 2023-01-01 ┆ 12.6 ┆ 10.4 ┆ 15.6 ┆ … ┆ 20.1 ┆ 53.7 ┆ 1011.1 ┆ null │
│ 2023-01-02 ┆ 9.1  ┆ 4.3  ┆ 12.8 ┆ … ┆ 12.6 ┆ 27.8 ┆ 1014.9 ┆ null │
│ 2023-01-03 ┆ 6.1  ┆ 1.1  ┆ 9.1  ┆ … ┆ 14.0 ┆ 44.5 ┆ 1024.3 ┆ null │
└────────────┴──────┴──────┴──────┴───┴──────┴──────┴────────┴──────┘
(See more examples in the examples directory, including how to fetch by Station ID.)
Key Concepts
Finding Stations
You can search for weather stations near a specific geographical location. This is useful when you don't know the exact station ID.
use meteostat::{Meteostat, MeteostatError, LatLon, InventoryRequest, Frequency, RequiredData};

#[tokio::main]
async fn main() -> Result<(), MeteostatError> {
    let client = Meteostat::new().await?;
    let nyc = LatLon(40.7128, -74.0060);

    // Find the 3 closest stations within 100km of NYC
    // that have reported *any* Daily data.
    let inventory_req = InventoryRequest::new(Frequency::Daily, RequiredData::Any);

    let stations = client.find_stations()
        .location(nyc)
        .max_distance_km(100.0)
        .station_limit(3)
        .inventory_request(inventory_req)
        .call()
        .await?;

    println!("Found {} stations near NYC matching criteria:", stations.len());
    for result in stations {
        println!("  - ID: {}, Name: {:?}, Distance: {:.1}km",
                 result.station.id,
                 result.station.name.get("en"),
                 result.distance_km
        );
    }
    Ok(())
}
Output
Found 3 stations near NYC matching criteria:
  - ID: KJRB0, Name: Some("New York / Wall Street"), Distance: 1.3km
  - ID: 72502, Name: Some("Newark Airport"), Distance: 3.3km
  - ID: KNYC0, Name: Some("New York City / Yorkville"), Distance: 8.0km
Once you have a station ID (e.g., from stations.first().unwrap().station.id), you can use it with
.station(&station_id) instead of .location(LatLon) in your data requests.
Working with Data: LazyFrames, Filtering, and Collection
All weather data fetching methods (e.g., client.daily().station("ID").call().await?) return a specific wrapper struct
like DailyLazyFrame, HourlyLazyFrame, etc. These wrappers contain a Polars LazyFrame.
This design allows you to:
- Apply Filters Lazily: Use methods on the wrapper (e.g.,
get_for_period(),get_range(),get_at()) to define filtering operations. These operations build up a query plan but don't execute immediately, saving memory and computation.get_for_period(Year(2023)): Get data for a whole year.get_for_period(NaiveDate::from_ymd_opt(2023,1,1).unwrap()): Get data for a specific day.get_range(start_datetime, end_datetime): Get data within a datetime range.get_at(NaiveDate::from_ymd_opt(2023,1,1).unwrap()): Get data for a single point in time.
- Collect Results: After filtering, you can collect the data:
- Into Rust Structs:
collect_daily(),collect_hourly(): Get aVec<Daily>,Vec<Hourly>, etc.collect_single_daily(),collect_single_hourly(): Get anResult<Daily, MeteostatError>,Result<Hourly, MeteostatError>etc.
- Into a Polars
DataFrame: Access the underlyingLazyFramevia the.framefield and then call.collect()?for advanced analysis with Polars.
- Into Rust Structs:
Example: Fetching a Single Day's Record into a Struct
use chrono::NaiveDate;
use serde_json::to_string_pretty;
use meteostat::{LatLon, Meteostat, MeteostatError};

#[tokio::main]
async fn main() -> Result<(), MeteostatError> {
    let client = Meteostat::new().await?;
    let specific_date = NaiveDate::from_ymd_opt(2023, 10, 26).unwrap();

    let daily_data = client
        .daily()
        .location(LatLon(52.520008, 13.404954))
        .call()
        .await? // DailyLazyFrame
        .get_at(specific_date)? // Filter for the specific date
        .collect_single_daily()?; // Attempt to collect a single Daily struct

    let json = to_string_pretty(&daily_data).unwrap(); // Convert the struct to JSON for pretty printing
    println!("{}", json);
    Ok(())
}
Output
{
  "date": "2023-10-26",
  "average_temperature": 9.7,
  "minimum_temperature": 9.2,
  "maximum_temperature": 10.5,
  "precipitation": null,
  "snow": null,
  "wind_direction": 53,
  "wind_speed": 10.1,
  "peak_wind_gust": 29.6,
  "pressure": 994.9,
  "sunshine_minutes": null
}
Refer to the documentation for HourlyLazyFrame, DailyLazyFrame, MonthlyLazyFrame, and ClimateLazyFrame for all
available filtering and collection methods.
Caching
The crate automatically caches downloaded data to minimize redundant downloads:
- Station Metadata: The global list of stations is downloaded once.
- Weather Data: Individual station data files are cached per station and frequency.
- When you request data newer than the age of the cache (with
.required_data), the cache will automatically refresh. - The cache can also be manually refreshed.
- When you request data newer than the age of the cache (with
Cache files are stored in your system's standard cache directory. Customize this with
Meteostat::with_cache_folder(path).
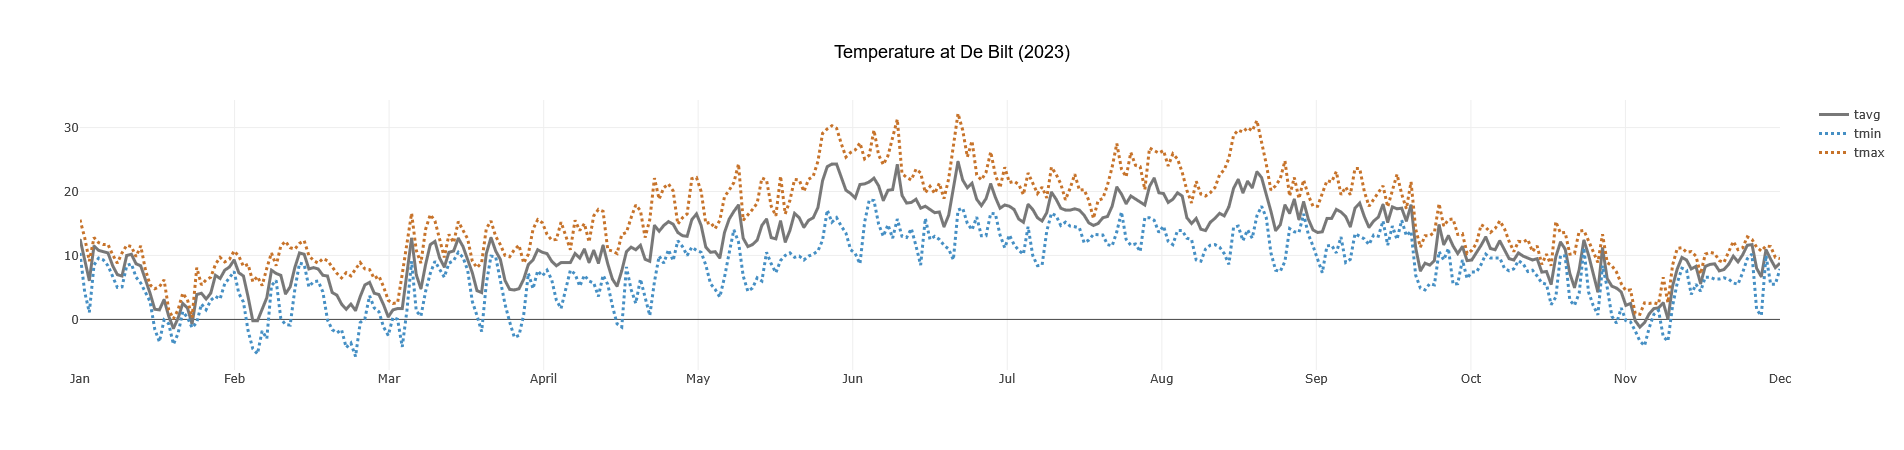
Example: Plotting Data
You can use the DataFrame output with plotting libraries like plotlars.
// This example requires the 'plotlars' feature for the crate
// or run it directly from the examples folder:
// cargo run --example graph_data --features "examples"
use std::error::Error;

use meteostat::{LatLon, Meteostat, Year};
use plotlars::{Line, Plot, Rgb, TimeSeriesPlot};
use polars::prelude::*;

#[tokio::main]
async fn main() -> Result<(), Box<dyn Error>> {
    let meteostat = Meteostat::new().await?;
    let location = LatLon(52.118641, 5.185589); // De Bilt, Netherlands

    let weather_data: DataFrame = meteostat
        .daily()
        .location(location)
        .call()
        .await?
        .get_for_period(Year(2023))?
        .frame
        .collect()?;

    plot_temperature(&weather_data);
    Ok(())
}

fn plot_temperature(dataset: &DataFrame) {
    if dataset.is_empty() {
        println!("No data to plot.");
        return;
    }
    TimeSeriesPlot::builder()
        .data(dataset)
        .x("date")
        .y("tavg")
        .additional_series(vec!["tmin", "tmax"])
        .colors(vec![
            Rgb(120, 120, 120), // tavg
            Rgb(69, 143, 196),  // tmin
            Rgb(199, 115, 42),  // tmax
        ])
        .lines(vec![Line::Solid, Line::Dot, Line::Dot])
        .plot_title("Temperature at De Bilt (2023)")
        .build()
        .plot();
    println!("Plot generated/shown (behavior depends on plotlars backend).");
}
(This generates a plot similar to the one at the top of this README)
Data Source and Attribution
- All weather data is sourced from Meteostat.
- This crate uses Meteostat's free bulk data interface. No API key is required.
API Documentation
Full API documentation is available on docs.rs.
Contributing
Contributions, bug reports, and feature requests are welcome! Please open an issue or submit a pull request on the GitHub repository.
License
This crate is licensed under the Apache License 2.0. See the LICENSE file.