rbf-interp
| Crates.io | rbf-interp |
| lib.rs | rbf-interp |
| version | 0.1.3 |
| created_at | 2019-06-06 18:07:57.958401+00 |
| updated_at | 2019-09-07 03:39:49.710616+00 |
| description | An implementation of Radial Basis Function multidimensional interpolation |
| homepage | |
| repository | https://github.com/linebender/rbf-interp |
| max_upload_size | |
| id | 139477 |
| size | 320,857 |
documentation
README
rbf-interp
This crate contains an implementation of Radial Basis Function multidimensional interpolation. For an excellent introduction to the topic, see the SIGGRAPH 2014 course notes.
The input is a set of datapoints, each of which has coordinates in some multidimensional
space, and a value, also provided as a vector. For example, for the colorfield images below,
the coordinates are 2D, and the values are a 3-vector, one each for red, green, and blue.
The result is a Scatter struct that can then be evaluated at any coordinate. The idea
is that the values vary smoothly with the coordinates, but coincide with the input at each
of the provided datapoints.
There are a number of approaches to multidimensional interpolation, but the focus of this crate is the family of radial basis functions. These include Polyharmonic splines, of which the thin plate spline is an instance, a Gaussian radial basis function, and others (muti-quadric and inverse multi-quadric). The Gaussian and multi-quadric variants also have a tunable size parameter.
In addition, there is an "order" parameter that controls low-order polynomial terms. An order of 0 means no additional terms, just pure basis functions. An order of 1 means a constant term, and and order of 2 means an affine term. With these additional terms, there is a "best-fit" constant or affine approximation of the input, and the basis functions are layered. (For a more precise description, see section 3.1 of the SIGGRAPH notes). Note that quadratic and higher order polynomials also make sense, but are not implemented currently.
The plots below are made with a Gaussian basis function with a deliberately too-small size parameter (0.05), to show more clearly the effect of the polynomial term:
With a reasonable value (1.0), results are spot-on:
Here are comparisons with two of the other basis functions, thin plate and triharmonic:
Note that the interpolation is pretty good, but the extrapolation (the region from 1.8 to 2.0 in these plots) is weaker.
Colorfield results
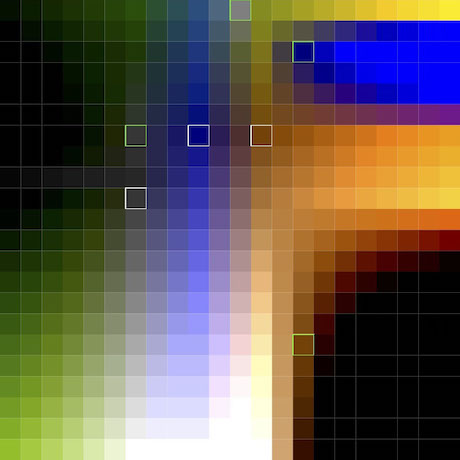
A major motivation for this crate is computing smoother interpolation for variable fonts. Earlier work in this space is MutatorMath, which uses multilinear interpolation for the task. The project page has a "colorfield" to demonstrate their interpolation techniques, which places an (r, g, b) color at each point in a 2D coordinate space. Note that for fonts generally the output is a 2D coordinate and the input is any number of variation axes (perhaps weight and width are the most common), but the colorfield is a good way to visualize the behavior of an interpolation scheme.
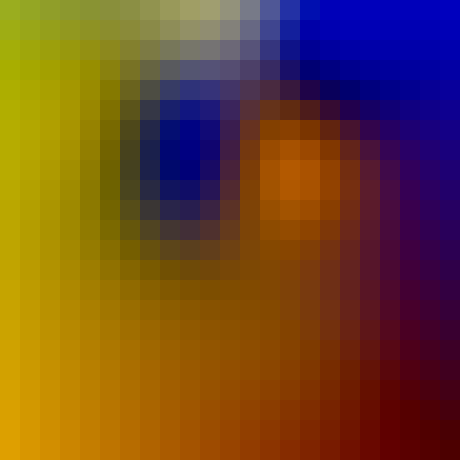
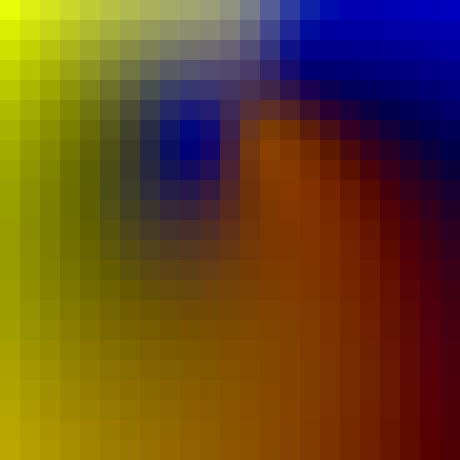
Below are the image from MutatorMath (scaled down), and radial basis results using Gaussian bumps with radius 4.5 and thin plate splines


The radius tuning parameter has a fairly profound effect on the results. This is a liability
in many application domains for multidimensional interpolation, but perhaps a good thing
for variable fonts, as it provides choice over the tradeoff between smoothness (perhaps
with overshoots) and local control. Curious people are encouraged to experiment with the
mutator example in the examples directory.
To run the example from a Unix shell:
cargo run --example mutator > image.ppm
Other resources
The following articles were of interest:
-
Radial Basis Function Interpolation (Wilma du Toit Masters Thesis)
Thanks to Jacob Rus for discussion and resources, and to LGM 2019 for providing a stimulating environment to develop these ideas.