re_perf_telemetry
| Crates.io | re_perf_telemetry |
| lib.rs | re_perf_telemetry |
| version | 0.29.0-alpha.7 |
| created_at | 2025-07-10 11:56:38.09918+00 |
| updated_at | 2026-01-23 15:23:14.334832+00 |
| description | In and out of process performance profiling utilities for Rerun & Redap |
| homepage | https://rerun.io |
| repository | https://github.com/rerun-io/rerun |
| max_upload_size | |
| id | 1746219 |
| size | 184,417 |
 rerun.io (rerunio)
documentation
README
re_perf_telemetry
Part of the rerun family of crates.

![]()
![]()
![]()
In and out of process telemetry and profiling utilities for Rerun & Redap.
Performance telemetry is always disabled by default. It is gated both by a feature flag (perf_telemetry) and runtime configuration in the form of environment variables:
TELEMETRY_ENABLED: is performance telemetry enabled at all (default:false)?TRACY_ENABLED: is the tracy integration enabled (default:false)? works even ifTELEMETRY_ENABLED=false, to reduce noise in measurements.OTEL_SDK_ENABLED: is the OpenTelemetry enabled (default:false)? does nothing ifTELEMETRY_ENABLED=false.
Note that despite the name, this crate also hands all log output to the telemetry backend.
What
re_perf_telemetry is a suite of developer tools that integrate with the tracing ecosystem and, by extension, make it possible to use:
- out-of-process IO-focused profilers such as the OpenTelemetry ecosystem (gRPC, trace propagation, distributed tracing, etc)
- in-process compute-focused profilers such as Tracy
What you can or cannot do with that depends on which project you're working on (Redap, Rerun SDK, Rerun Viewer). See below for more information.
Redap
If you have source access to the Rerun dataplatform check the Readme there.
Rerun SDK
In the Rerun SDK, re_perf_telemetry is always disabled by default (feature flagged), and only meant as a developer tool: it never ships with the final user builds.
The integration works pretty well for both out-of-process and in-process profiling.
We'll use the following script as an example:
import rerun as rr

client = rr.catalog.CatalogClient("rerun://sandbox.redap.rerun.io")
client.dataset_entries()

dataset = client.get_dataset_entry(name="droid:raw")

# Get the RecordBatch reader from the query view
df = dataset.dataframe_query_view(
    index="real_time",
    contents={"/camera/ext1": ["VideoFrameReference:timestamp"]},
).df()

print(df.count())
-
Example of out-of-process profiling using Jaeger (run
pixi run compose-devin the Redap repository to start a Jaeger instance):# Build the SDK with performance telemetry enabled, in the 'examples' environment: $ py-build-perf-examples # Run your script with both telemetry and the OpenTelemetry integration enabled: $ TELEMETRY_ENABLED=true OTEL_SDK_ENABLED=true <your_script> # Go to the Jaeger UI (http://localhost:16686/search) to look at the results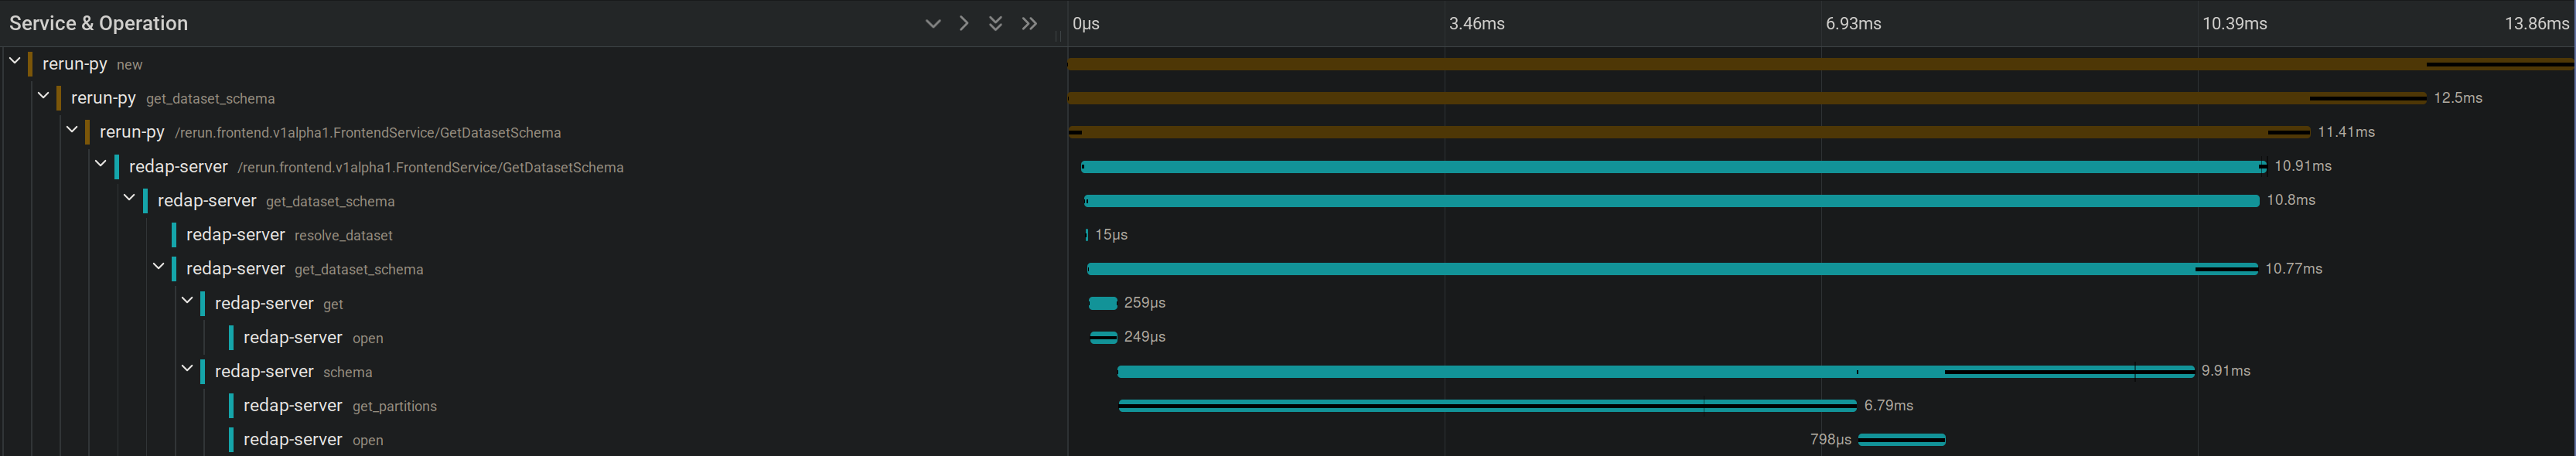
-
Example of in-process profiling using Tracy:
# Build the SDK with performance telemetry enabled, in the 'examples' environment:
$ py-build-perf-examples

# Run your script with both telemetry and the Tracy integration enabled:
$ TELEMETRY_ENABLED=true TRACY_ENABLED=true <your_script>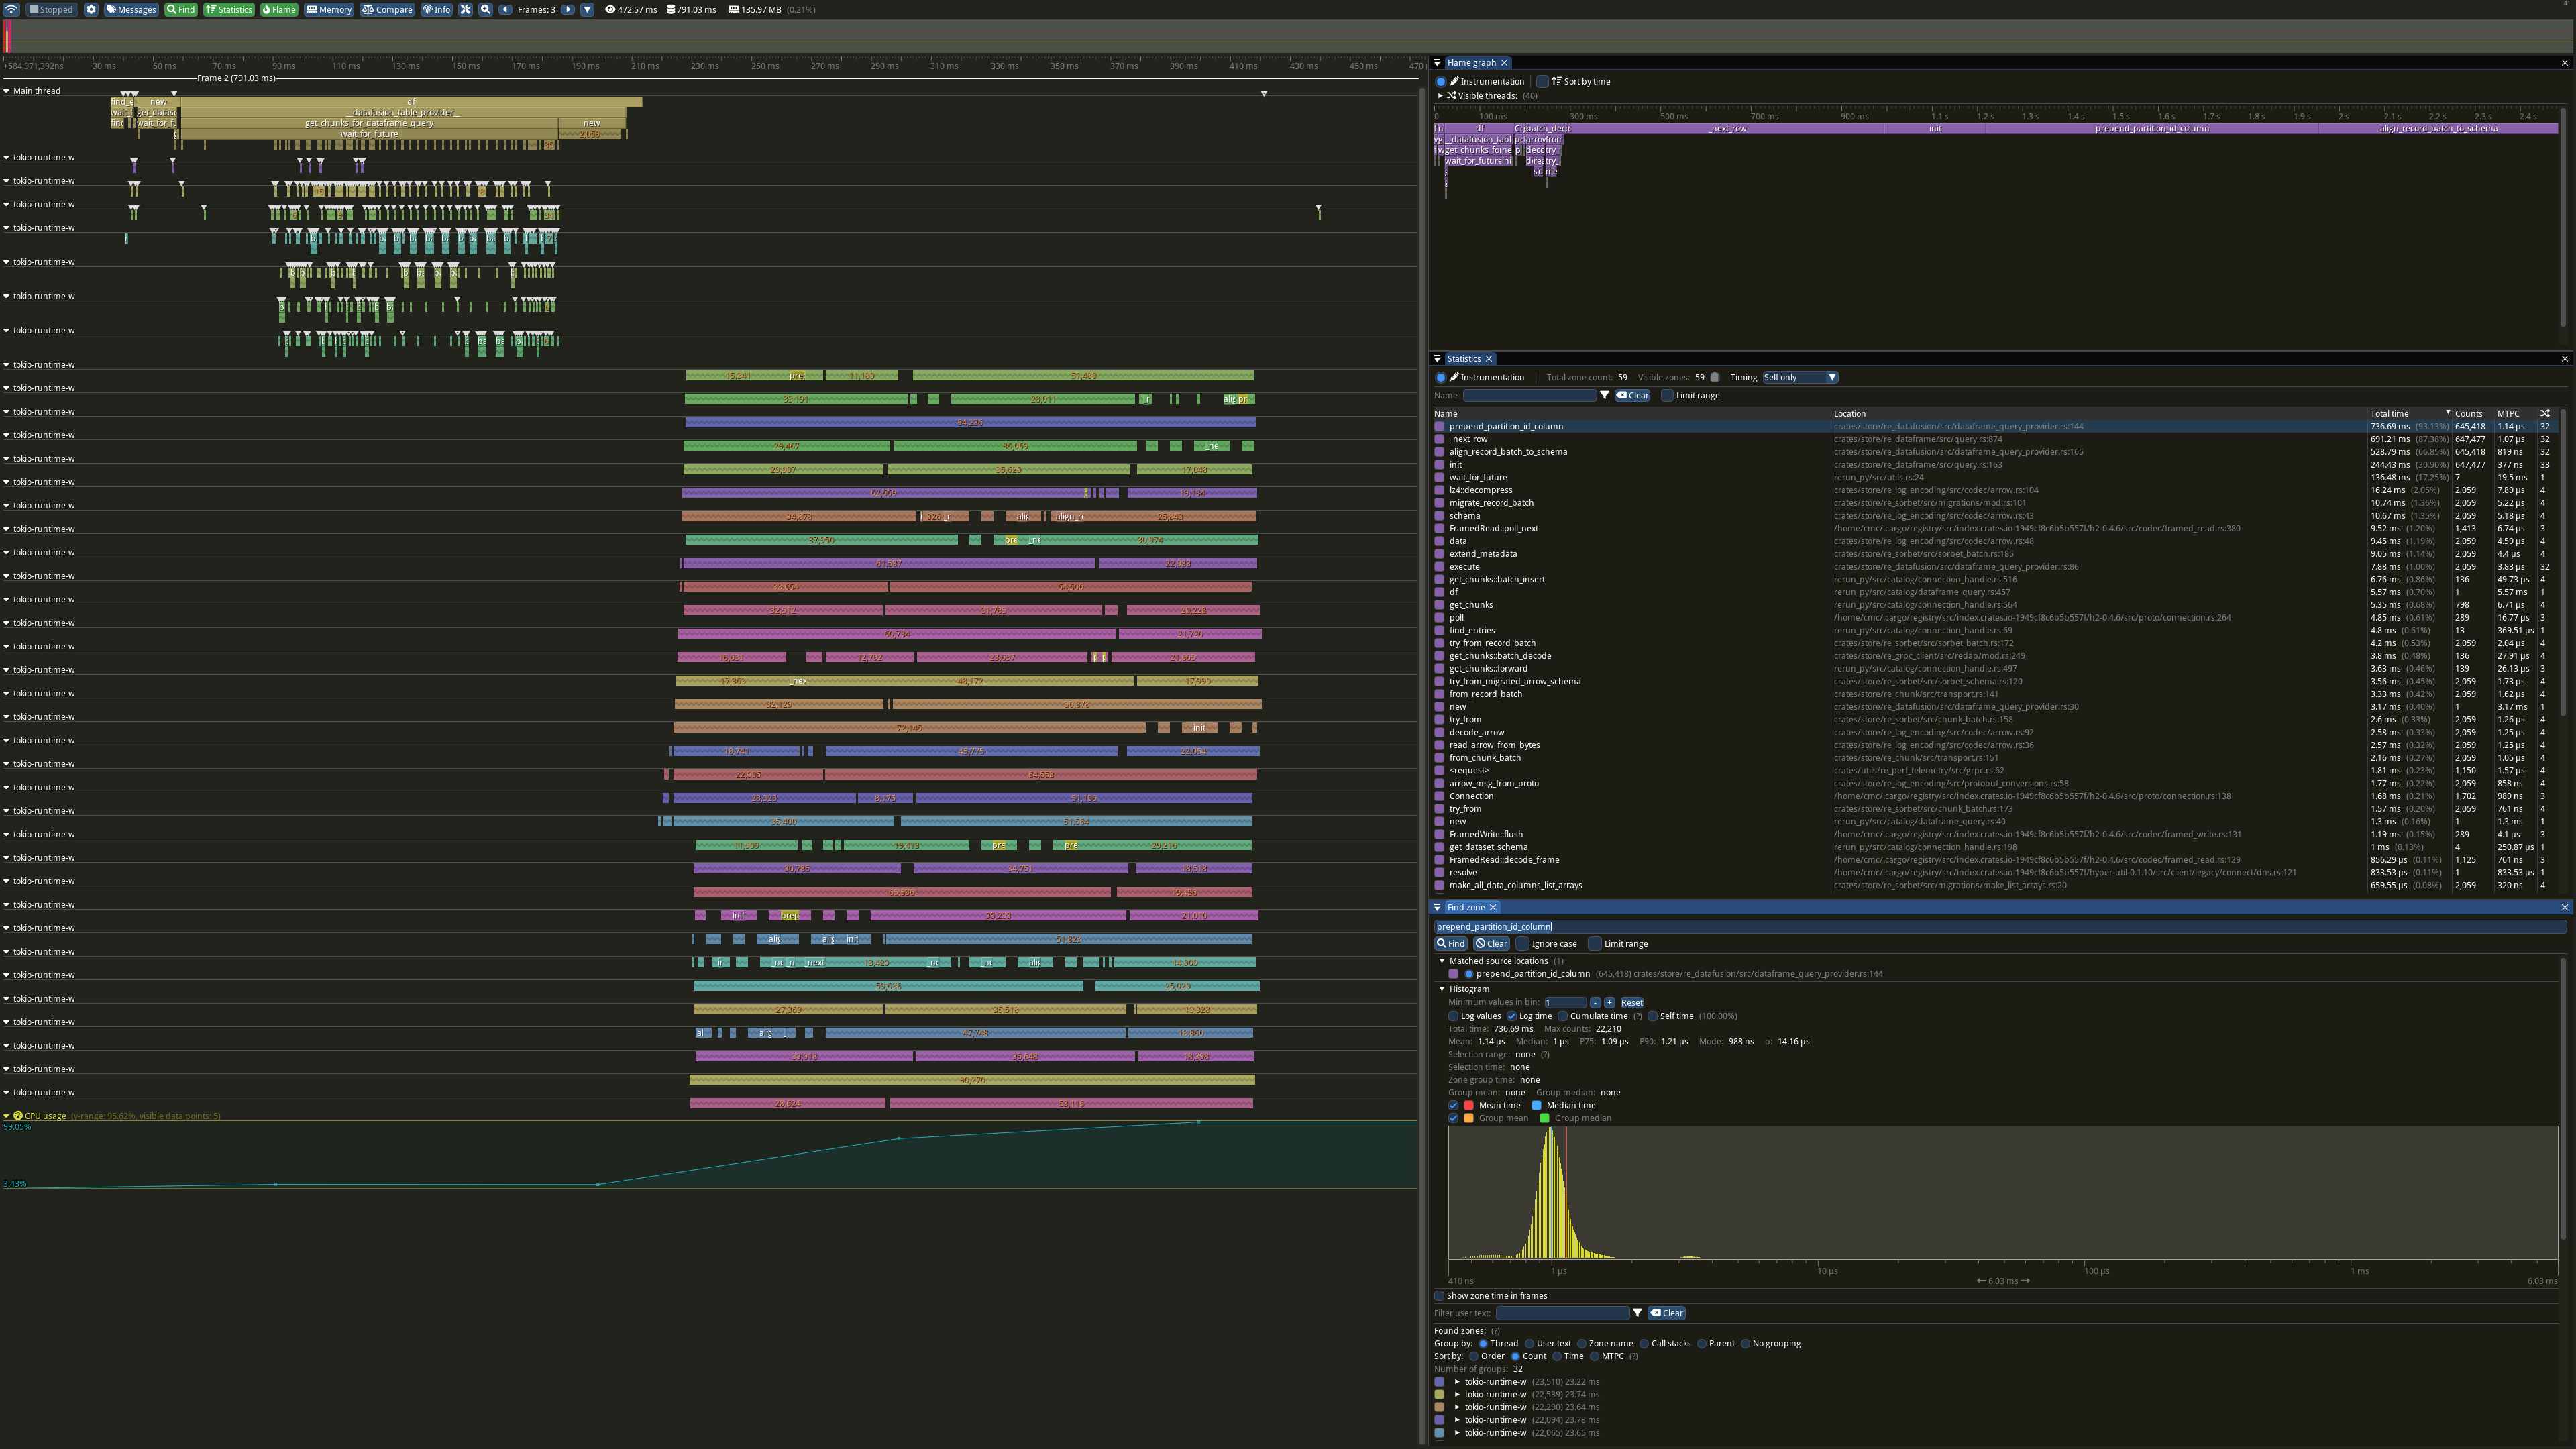


Future work
-
Integration with datafusion-tracing
Rerun Viewer
In the Rerun Viewer, re_perf_telemetry is always disabled by default (feature flagged), and only meant as a developer tool: it never ships with the final user builds.
The integration only really works with in-process profiling, and even then with caveats (see Limitations and Future work below).
-
Example of in-process profiling using Tracy:
# Start the viewer with both telemetry and the Tracy integration enabled:
$ TELEMETRY_ENABLED=true TRACY_ENABLED=true pixi run rerun-perf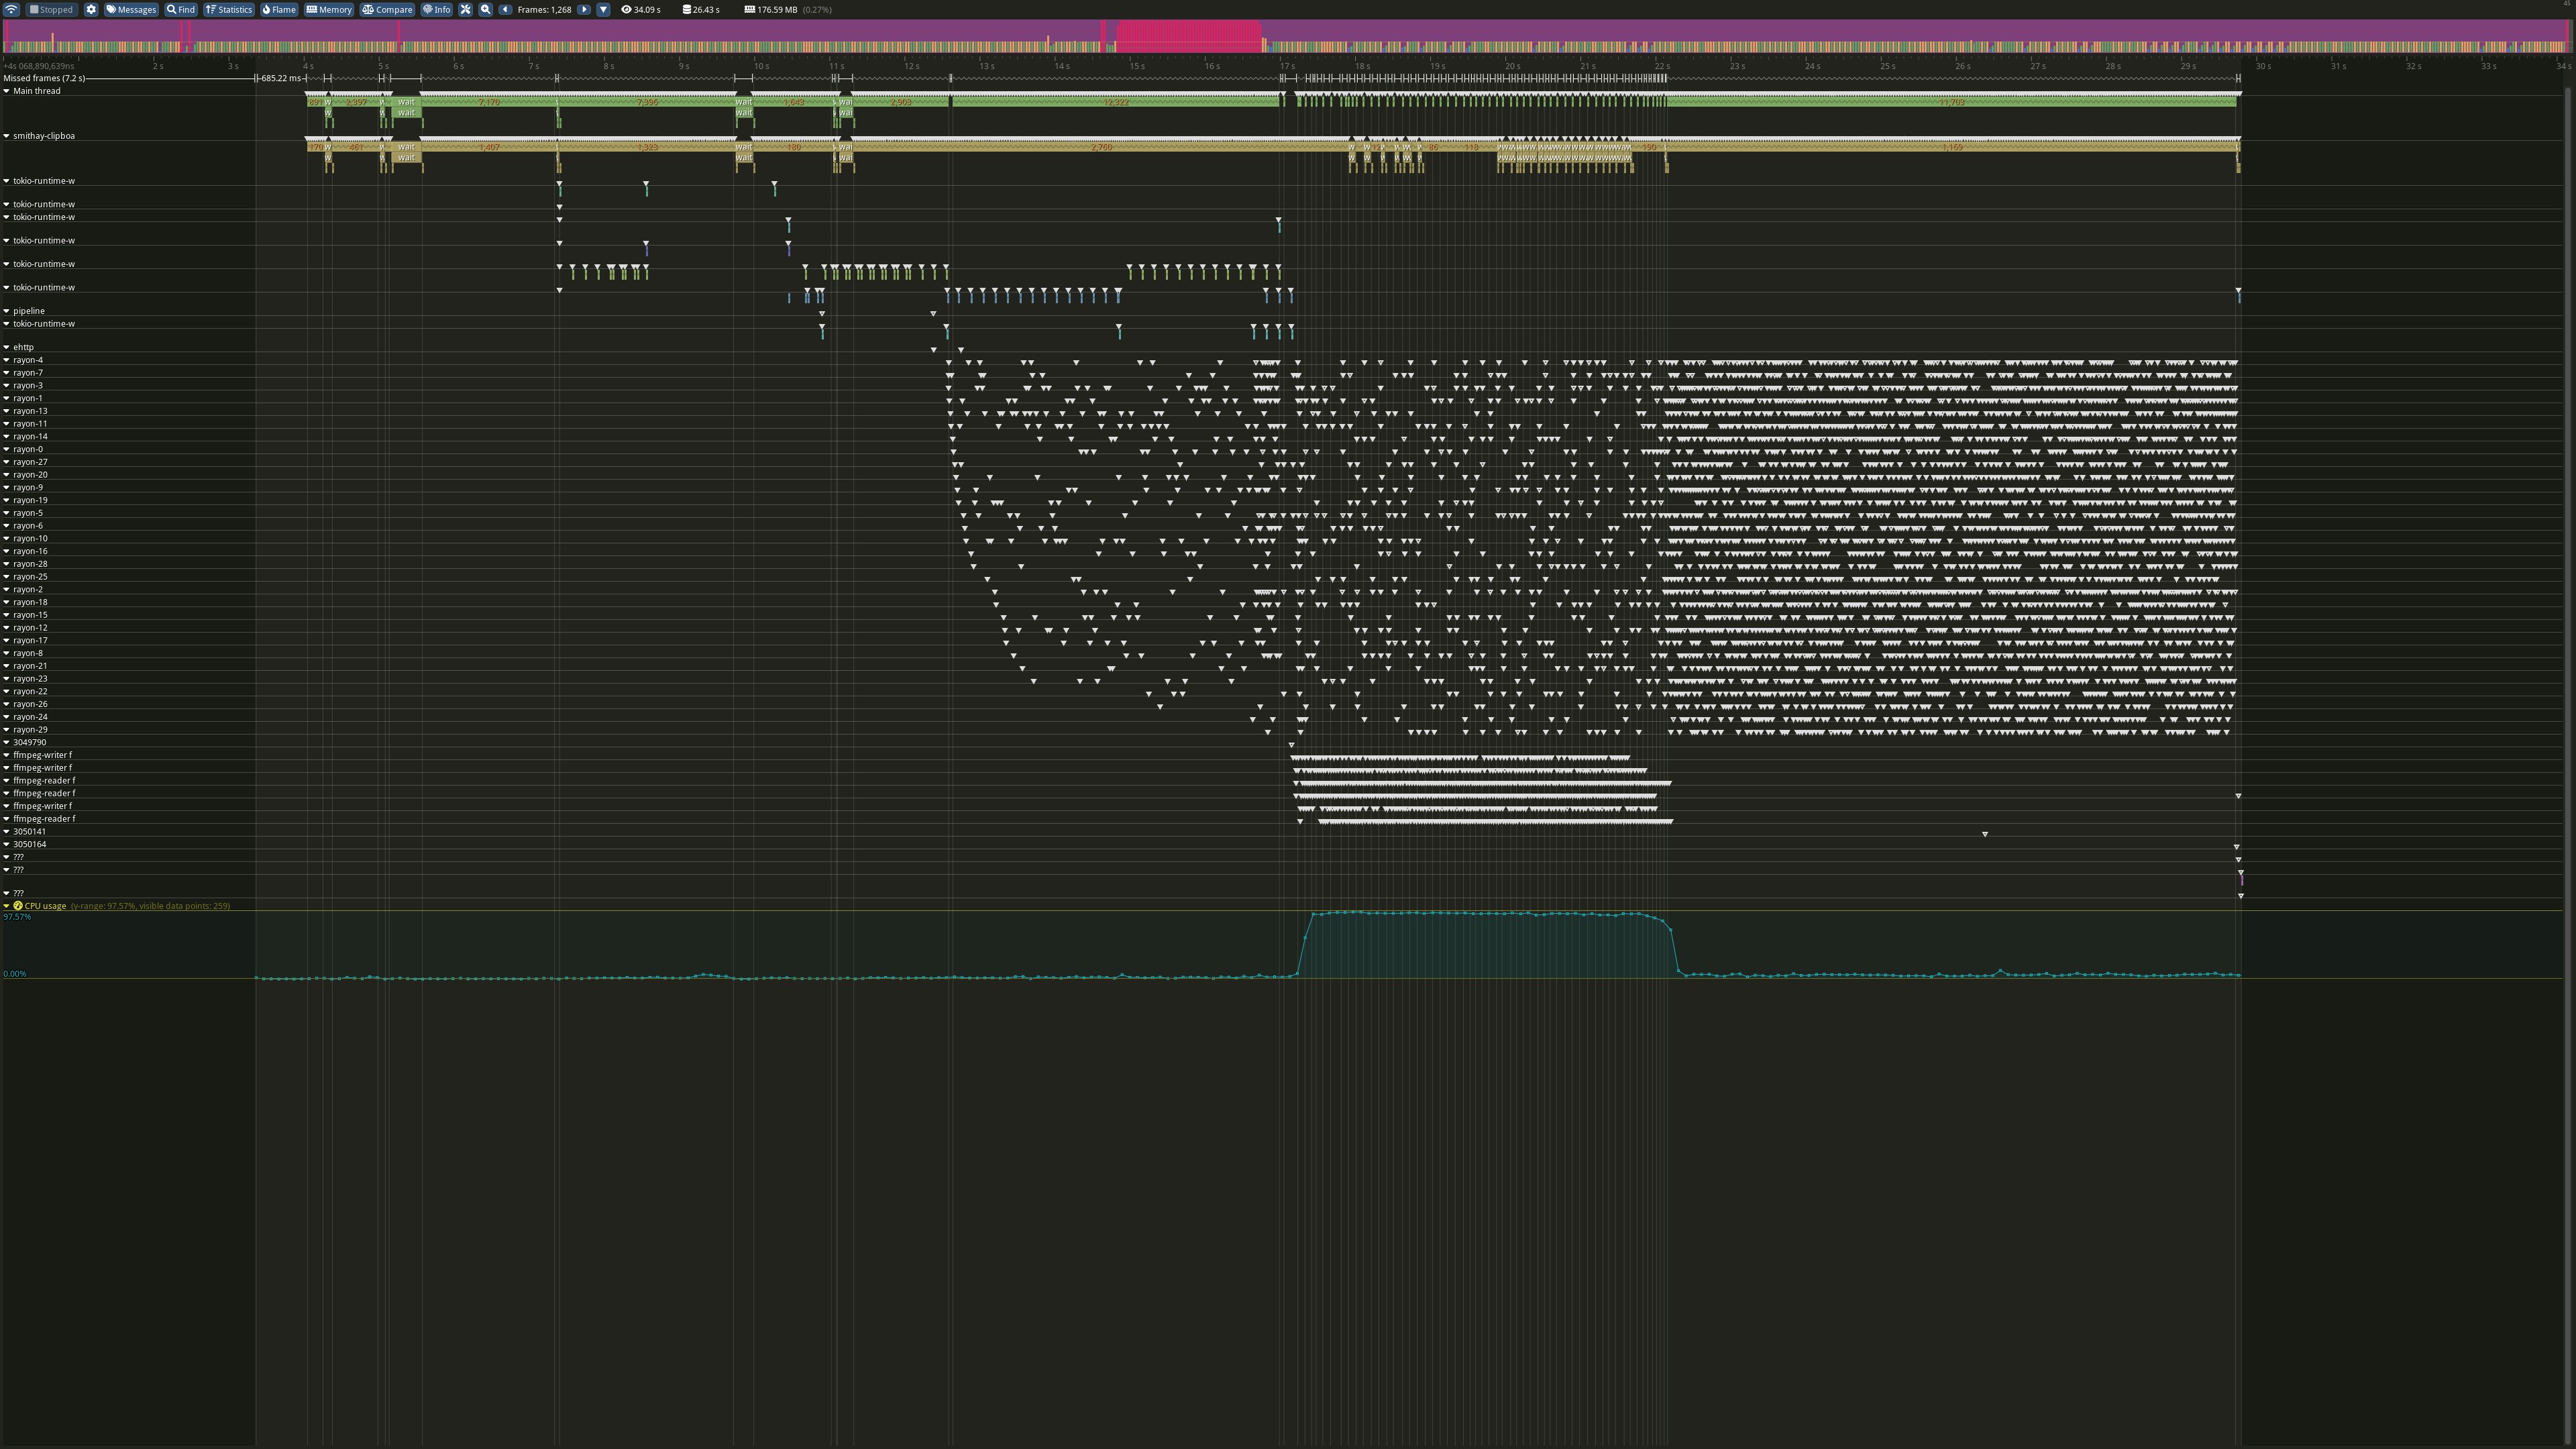

Limitations
-
puffinspans are not forwarded to the perf telemetry tools While this is technically do-able (for instance by replacingpuffincalls with theprofilingcrate), ourpuffinspans were not implemented with the kind of overhead that thetracinginvolves in mind anyway. A possible future approach would be a native Tracy integration for the Viewer, seeFuture workbelow. -
The viewer will crash during shutdown when perf telemetry is enabled This is actually unrelated to
re_perf_telemetryAFAICT: the viewer will crash on exit because of what appears to be a design flaw intracing-subscriber's shutdown implementation, specifically it assumes that all the relevant thread-local state will be dropped in the proper order, when really it won't and there's no way to guarantee that. See https://github.com/tokio-rs/tracing/issues/3239. Since this is a very niche feature only meant to be used for deep performance work, I think this is fine for now (and I don't think there's anything we can do from userspace anyhow, this is a puretracingvs. Rust's TLS implementation issue).
Future work
The Rerun Viewer would greatly benefit from a native Tracy integration (i.e. using the Tracy client directly, instead of going through the tracing ecosystem).
This would not only alleviate the overhead of the tracing ecosystem, it would also make it possible to use all the more advanced features of Tracy in the viewer (e.g. GPU spans, framebuffer previews, allocation tracing, contention spans, plots, sub-frames, etc).
Check out this web demo for a taste of what a native Tracy integration can do.