wbi-rs
| Crates.io | wbi-rs |
| lib.rs | wbi-rs |
| version | 0.1.11 |
| created_at | 2025-08-20 16:35:05.143025+00 |
| updated_at | 2026-01-09 22:37:18.520476+00 |
| description | A Rust library + CLI to fetch, store, visualize, and summarize World Bank indicator data. |
| homepage | https://crates.io/crates/wbi-rs |
| repository | https://github.com/ArdentEmpiricist/world_bank_data_rust |
| max_upload_size | |
| id | 1803683 |
| size | 3,315,635 |
 Hendrik Lux (ArdentEmpiricist)
documentation
README


![]()
![]()

![]()
wbi-rs 🦀📊📈
![]()
Fetch, analyze, and visualize World Bank data from Rust.
This project provides a CLI, GUI, and library API to retrieve time series from the World Bank API, export them safely (CSV/JSON), compute grouped statistics, and render charts (SVG/PNG) with Plotters.
Table of contents
- Features
- Install
- Quick start (CLI)
- Country-Consistent Styling
- GUI Application
- CLI usage
- Library usage
- Data formats
- Security & reliability
- Testing
- Contributing
- License
- Disclaimer
Features
What it can do
- Retrieve data from the World Bank by country/countries, indicator(s), and optional date range.
- Multi-indicator requests work without specifying a World Bank
source; the client transparently fans out per indicator when--sourceis omitted, while still supporting the single-call path when--sourceis provided. - Show short stats in the terminal (grouped min / max / mean / median per (indicator, country)).
- Export datasets to CSV or JSON (format inferred from
--outextension or set via--format).
Exports are atomic and CSV is spreadsheet-safe. - Export plots as SVG or PNG (backend inferred from
--plotfile extension). - Country-consistent styling: when enabled via
--country-styles, series from the same country share consistent base colors while indicators are differentiated by shades and patterns.
Under the hood
- Hardened HTTPS client (rustls, connect/request timeouts, limited redirects, descriptive
User-Agent:wbi_rs). - Robust URL handling
- Transient error resilience (small retry/backoff) and page caps.
- Valid JSON under all inputs (
NaN/±∞→null). - Numerical stability (non-finite values treated as missing; safe float sorting).
- Portable plotting with an embedded TTF font for CI/headless environments.
Install
Download a prebuilt binary (GitHub Releases):
- Go to GitHub → Releases: https://github.com/ArdentEmpiricist/wbi-rs/releases/latest
- Download the binary for your platform
Via cargo/crates.io:
# Install both CLI and GUI binaries (default)
cargo install wbi-rs
wbi --help    # CLI binary
wbi-gui       # GUI binary

# Install CLI only
cargo install wbi-rs --bin wbi
wbi --help

# Install GUI only
cargo install wbi-rs --bin wbi-gui
wbi-gui
From source:
git clone <this-repo>
cd wbi-rs

# Build both CLI and GUI binaries (default)
cargo build --release

# Build CLI only
cargo build --release --bin wbi

# Build GUI only
cargo build --release --bin wbi-gui
As a library (example):
[dependencies]
wbi-rs = "0.1" # or your path
anyhow = "1"
Quick start (CLI)
Fetch population for Germany & France (2000–2023), write to CSV (format inferred from extension) and show quick stats in terminal:
wbi get \
  --countries DEU,FRA \
  --indicators SP.POP.TOTL \
  --date 2000:2023 \
  --out pop.csv \
  --stats
Output:

Fetch GDP (in current US$) for the US, China, Germany and India and render a plot (backend inferred from extension):
wbi get \
  --countries USA,CHN,DEU,IND \
  --indicators NY.GDP.MKTP.CD \
  --date 1970:2025 \
  --plot pop.svg \
  --plot-kind line-points
Output:

Country-Consistent Styling
You can enable country-consistent styling where all series for the same country share one base hue from the MS Office palette, while indicators within that country are differentiated by shades:
# Use country-consistent styling
wbi get \
  --countries USA,CHN,IND,DEU \
  --indicators SP.POP.TOTL,SP.POP.TOTL.FE.IN \
  --date 2010:2020 \
  --plot multi_indicator.svg \
  --plot-kind line-points \
  --country-styles
This feature ensures that:
- All series from the same country use the same base color hue
- Different indicators within a country are differentiated by brightness variations
- The styling is deterministic and consistent across runs
Output:

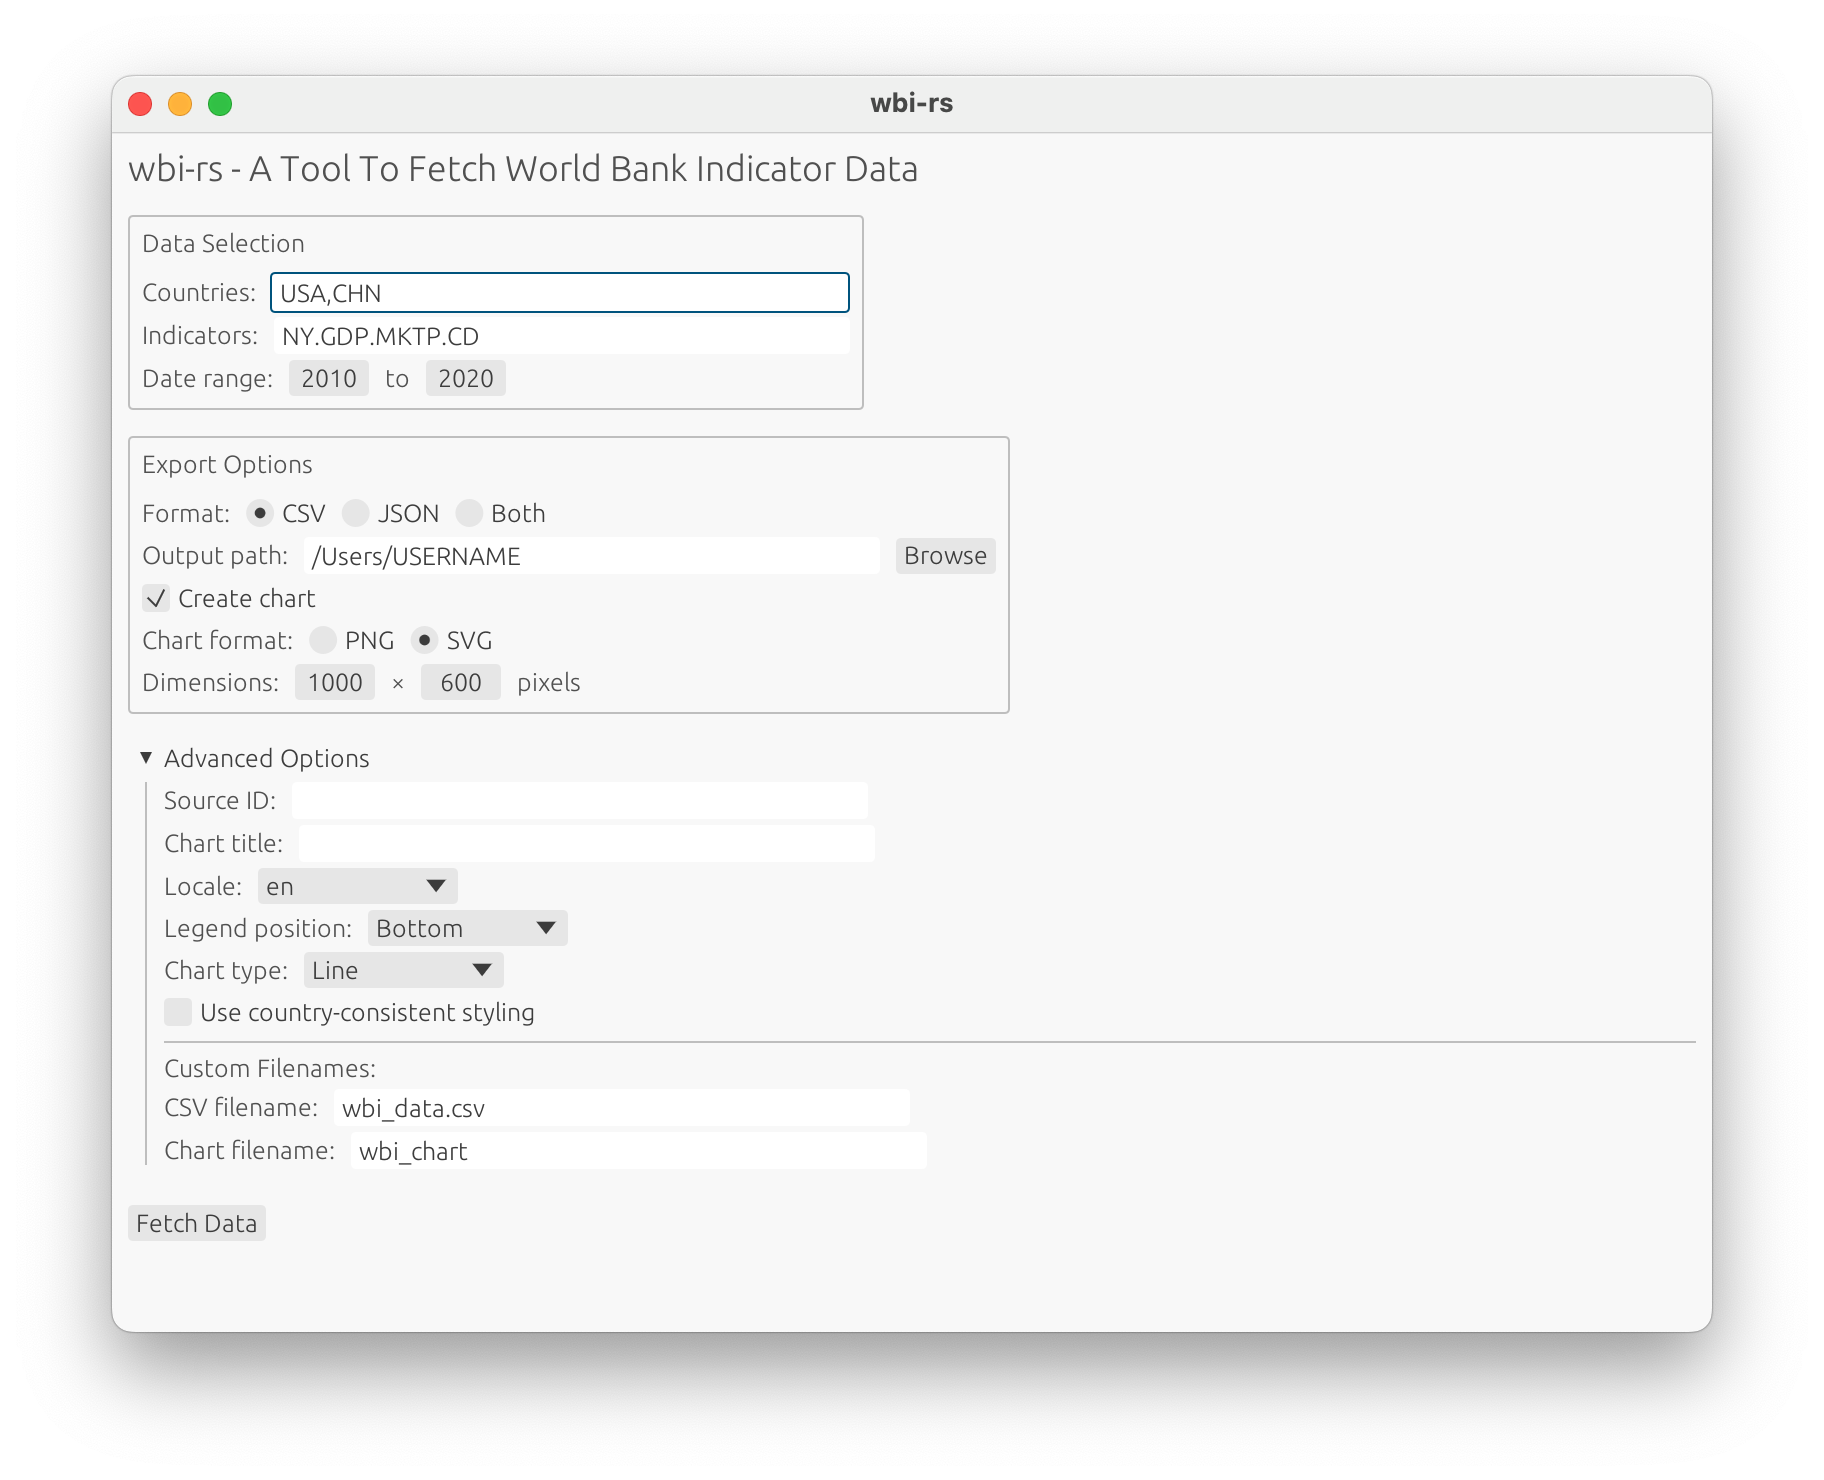
GUI Application
For users who prefer a graphical interface, wbi-rs includes a modern, cross-platform desktop application.
Installation and Usage
Build and run the GUI:
cargo build --release --bin wbi-gui
cargo run --release --bin wbi-gui
Features-GUI
The GUI provides an intuitive interface for:
- Data Selection: Easy input fields for countries and indicators
- Date Range: Visual controls for selecting start and end years
- Export Options: Choose CSV, JSON, or both formats
- Chart Creation: Generate professional PNG or SVG charts
- Advanced Configuration: Access all CLI features through collapsible advanced options
- File Management: Native file browser integration with home directory defaults
- Real-time Feedback: Progress indicators and clear error messages
Advanced options for plots only visible if "Create chart" checkbox is active.
Platform Support
The GUI application works on:
- Windows: Native look and feel
- macOS: Cocoa interface
- Linux: X11 and Wayland support
Example Workflow
- Enter countries:
USA,DEU,CHN - Enter indicators:
SP.POP.TOTL,NY.GDP.MKTP.CD - Set date range: 2010 to 2020
- Choose export format: CSV
- Enable chart creation: PNG format
- Click "Fetch Data"
The application will download the data, save it to your chosen location, and create a chart—all with a single click.
CLI usage
Subcommand get accepts at least:
--countriesISO2/ISO3 codes separated by,or;(e.g.,DEU,FRAor (attention:" "are required using;)"DEU;FRA")--indicatorsWorld Bank indicator IDs (e.g.,SP.POP.TOTL)--dateoptional year or range (e.g.,2020or2000:2023)--sourceoptional source ID (e.g.,2for WDI). Recommended for efficiency when querying multiple indicators, but optional.--out <PATH>optional export (CSV/JSON); atomic--plot <PATH>optional chart output (SVG/PNG), using Plotters--country-stylesenable country-consistent styling with optional mode (on|symbols|off)
Format inference for --out
- If
--formatis not provided, the format is inferred:.csv→ CSV.json→ JSON- no extension → defaults to CSV
- unknown extension (with no
--format) → error
- If
--formatis provided:- It must match known extensions; conflicting combinations (e.g.,
--out data.csv --format json) error early - For unknown extensions, the explicit format wins
- It must match known extensions; conflicting combinations (e.g.,
Examples
# CSV via extension inference
wbi get --countries DEU --indicators SP.POP.TOTL --out data.csv

# JSON via extension inference
wbi get --countries DEU --indicators SP.POP.TOTL --out data.json

# Unknown extension allowed when --format is explicit
wbi get --countries DEU --indicators SP.POP.TOTL --out dump.xyz --format csv

# Error on conflict
wbi get --countries DEU --indicators SP.POP.TOTL --out data.csv --format json
Library usage
The crate exposes modules for API access, models, storage, statistics, and plotting.
Add to Cargo.toml
[dependencies]
wbi-rs = "0.1" # or "{ path = "." } to your source"
anyhow = "1"
Fetch data
use anyhow::Result;
use wbi_rs::api::Client;
use wbi_rs::models::DateSpec;

fn main() -> Result<()> {
    // Hardened blocking client (rustls, timeouts, redirect policy, UA)
    let api = Client::default();

    // Countries & indicators can be given as lists; date is optional
    let points = api.fetch(
        &["DEU".into(), "FRA".into()],
        &["SP.POP.TOTL".into()],
        Some(DateSpec::Range { start: 2000, end: 2023 }),
        None, // source id
    )?;

    println!("rows: {}", points.len());
    Ok(())
}
For multi-indicator requests when source is None, the client automatically handles fallback behavior by making separate requests per indicator to ensure data retrieval succeeds.
The fetch method automatically enriches DataPoint.unit values when observation rows lack a unit by fetching metadata from the World Bank indicator endpoint. This ensures that visualization and analysis code has access to appropriate unit information for axis labeling and scaling decisions.
If you need to manually fetch indicator units for specific indicators:
let units = api.fetch_indicator_units(&["SP.POP.TOTL".into(), "NY.GDP.MKTP.CD".into()])?;
// Returns HashMap<String, String> mapping indicator ID to unit
Export data (atomic CSV/JSON)
use wbi_rs::storage::{save_csv, save_json};

save_csv(&points, "pop.csv")?;   // spreadsheet-safe + atomic
save_json(&points, "pop.json")?; // non-finite -> null + atomic
- CSV: fixed header order; cells beginning with
=,+,-,@are prefixed with'. - JSON: pretty-printed; non-finite floats are serialized as
null.
Both writers use a tempfile in the destination directory and atomically replace the target file.
Compute grouped summaries
use wbi_rs::stats::{grouped_summary, Summary};

let summaries: Vec<Summary> = grouped_summary(&points);
// Summary contains: key (indicator_id, country_iso3), count, missing, min, max, mean, median.
// Non-finite values are counted as missing; sorting avoids panics on floats.
Plot charts
use wbi_rs::viz::plot_chart;

// `plot_chart` filters non-finite values and sorts by integer year.
// The backend is selected from the output extension (.svg, .png).
plot_chart(&points, "pop.svg")?;
Charts automatically derive appropriate units for axis labeling using a two-tier approach:
- Prefer units from DataPoint.unit: When all points have the same non-empty unit, use it directly for axis labeling
- Fallback to indicator name parsing: For single-indicator plots without consistent units, extract unit information from parentheses in the indicator name (e.g., "GDP (current US$)" → "current US$")
This approach ensures that both API-provided units and legacy indicator naming conventions are properly handled for visualization.
Data model
// Simplified view
pub struct DataPoint {
    pub indicator_id: String,
    pub indicator_name: String,
    pub country_id: String,
    pub country_name: String,
    pub country_iso3: String,
    pub year: i32,
    pub value: Option<f64>,   // may be None for missing
    pub unit: Option<String>,
    pub obs_status: Option<String>,
    pub decimal: Option<i64>,
}
Data formats
CSV
- Header:
indicator_id, indicator_name, country_id, country_name, country_iso3, year, value, unit, obs_status, decimal - Quoting/escaping: handled by the
csvcrate (RFC-4180) - Missing values:
None→ empty cell - Safety: cells beginning with
=,+,-,@are prefixed with'(prevents formula execution)
JSON
- Shape: array of objects mirroring the CSV fields
- Numbers: non-finite floats serialized as
null - Formatting: pretty-printed for readability
Security & reliability
- Networking
- TLS via
rustls - Request + connect timeouts, limited redirects
- Descriptive
User-Agent - Percent-encoding for user-supplied path segments
- Small retry/backoff on transient failures
- Hard cap on pages to avoid runaway jobs
- TLS via
- Exports
- Atomic writes for CSV/JSON
- CSV formula guard
- Valid JSON under all numeric inputs
- Numerics
- Non-finite values filtered/treated as missing
- Safe sorting; integer year ordering for plots
- Rendering
- Embedded font registration avoids “FontUnavailable” in headless/CI
Testing
Run all tests:
# use without --feature online to test local only
cargo test --features online
Coverage includes:
- CSV formula guard (prefix
') - Output format logic in
cmd_get(inference, explicit flags, conflicts) - Basic numeric guards (non-finite handling)
Contributing
Contributions are welcome! Please follow these guidelines:
-
Discuss major changes first: open an issue to align on scope/design before large features or public API changes.
-
Keep PRs focused: small, single-purpose PRs are easier to review and merge.
-
Code quality: ensure all of the following pass locally or supply arguments why some parts do not pass:
cargo fmt --all cargo clippy --all-targets --all-features -- -D warnings cargo test --all -- --nocapture -
Commit messages: using Conventional Commits is appreciated (e.g.,
feat:,fix:,docs:). -
License: by contributing, you agree your changes are dual MIT and Apache-2.-licensed.
License
Licensed under either of
at your option.
Any contribution intentionally submitted for inclusion in this work shall be dual licensed as above, without any additional terms or conditions.
Disclaimer
This project is an independent, community-maintained library and CLI. It is not affiliated with, endorsed by, or sponsored by The World Bank Group or any of its institutions. “The World Bank” name and any related trademarks are the property of The World Bank Group and are used here solely for identification purposes.
This software accesses publicly available data via the World Bank Indicators API. Your use of any World Bank data is governed by the World Bank’s terms and applicable data licenses. No warranty is provided; use at your own risk.
- World Bank Indicators API: https://datahelpdesk.worldbank.org/knowledgebase/articles/889392
- World Bank Terms of Use: https://www.worldbank.org/terms
- World Bank Data Terms (incl. licensing): https://datacatalog.worldbank.org/terms-and-conditions